The
slum of Kibera includes 13 villages. It is located approximately 5km
southwest of Nairobi city centre and its size is equal to about 75% of
the area of Manhattan's Central Park (approximately 2.5 square
kilometres, 256 hectares, or 630 acres).Kibera
has been known for being the biggest informal urban settlements
in Africa. A number of actors (governmental and local institutions,
NGOs, CBOs, scholars, mass-media) have provided and published over the
years growing estimates of the dimensions of the population of the slum.
Most of them stated that it was the largest slum in Africa
with a number of people reaching over 1 million. (see some references)
In
2008, the MKP team took a census of the population in the village of Kianda. On the basis of this census, the
MKP team estimated that the whole Kibera slum could be inhabited by a total population ranging from 235,000 to a maximum of 270,000 people, dramatically scaling down all previous figures.
Such
estimate was proved to be more realistic than the previous ones as
the 2009 Kenya Population and Housing Census finally reported Kibera's
population as 170,070.
Some outcomes and analysis from the MKP are published in:
___________________________________________________________________________________________
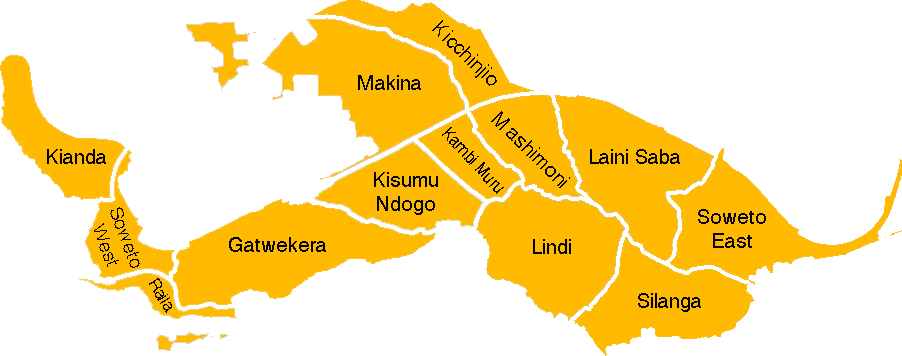
KIANDA (Pilot site)
Kianda is one of the 13 villages in the slum of Kibera.
It is located on the border with middle and upper-class Neighbourhoods.
Due to 24h pubs and the diffusion of prostitution, Kianda is one of the most problematic villages in Kibera.
Insecurity here is also due to the dispute on land among Luos and Nubians, which made this village a hot spot during post election violences in 2008.
It is also the leading village in HIV diffusion, and this brought here many specialized clinics which are said to be among the best ones in the area.
The southern side of the village borders with the beautiful ngong forest.
| |
Kianda Statistics
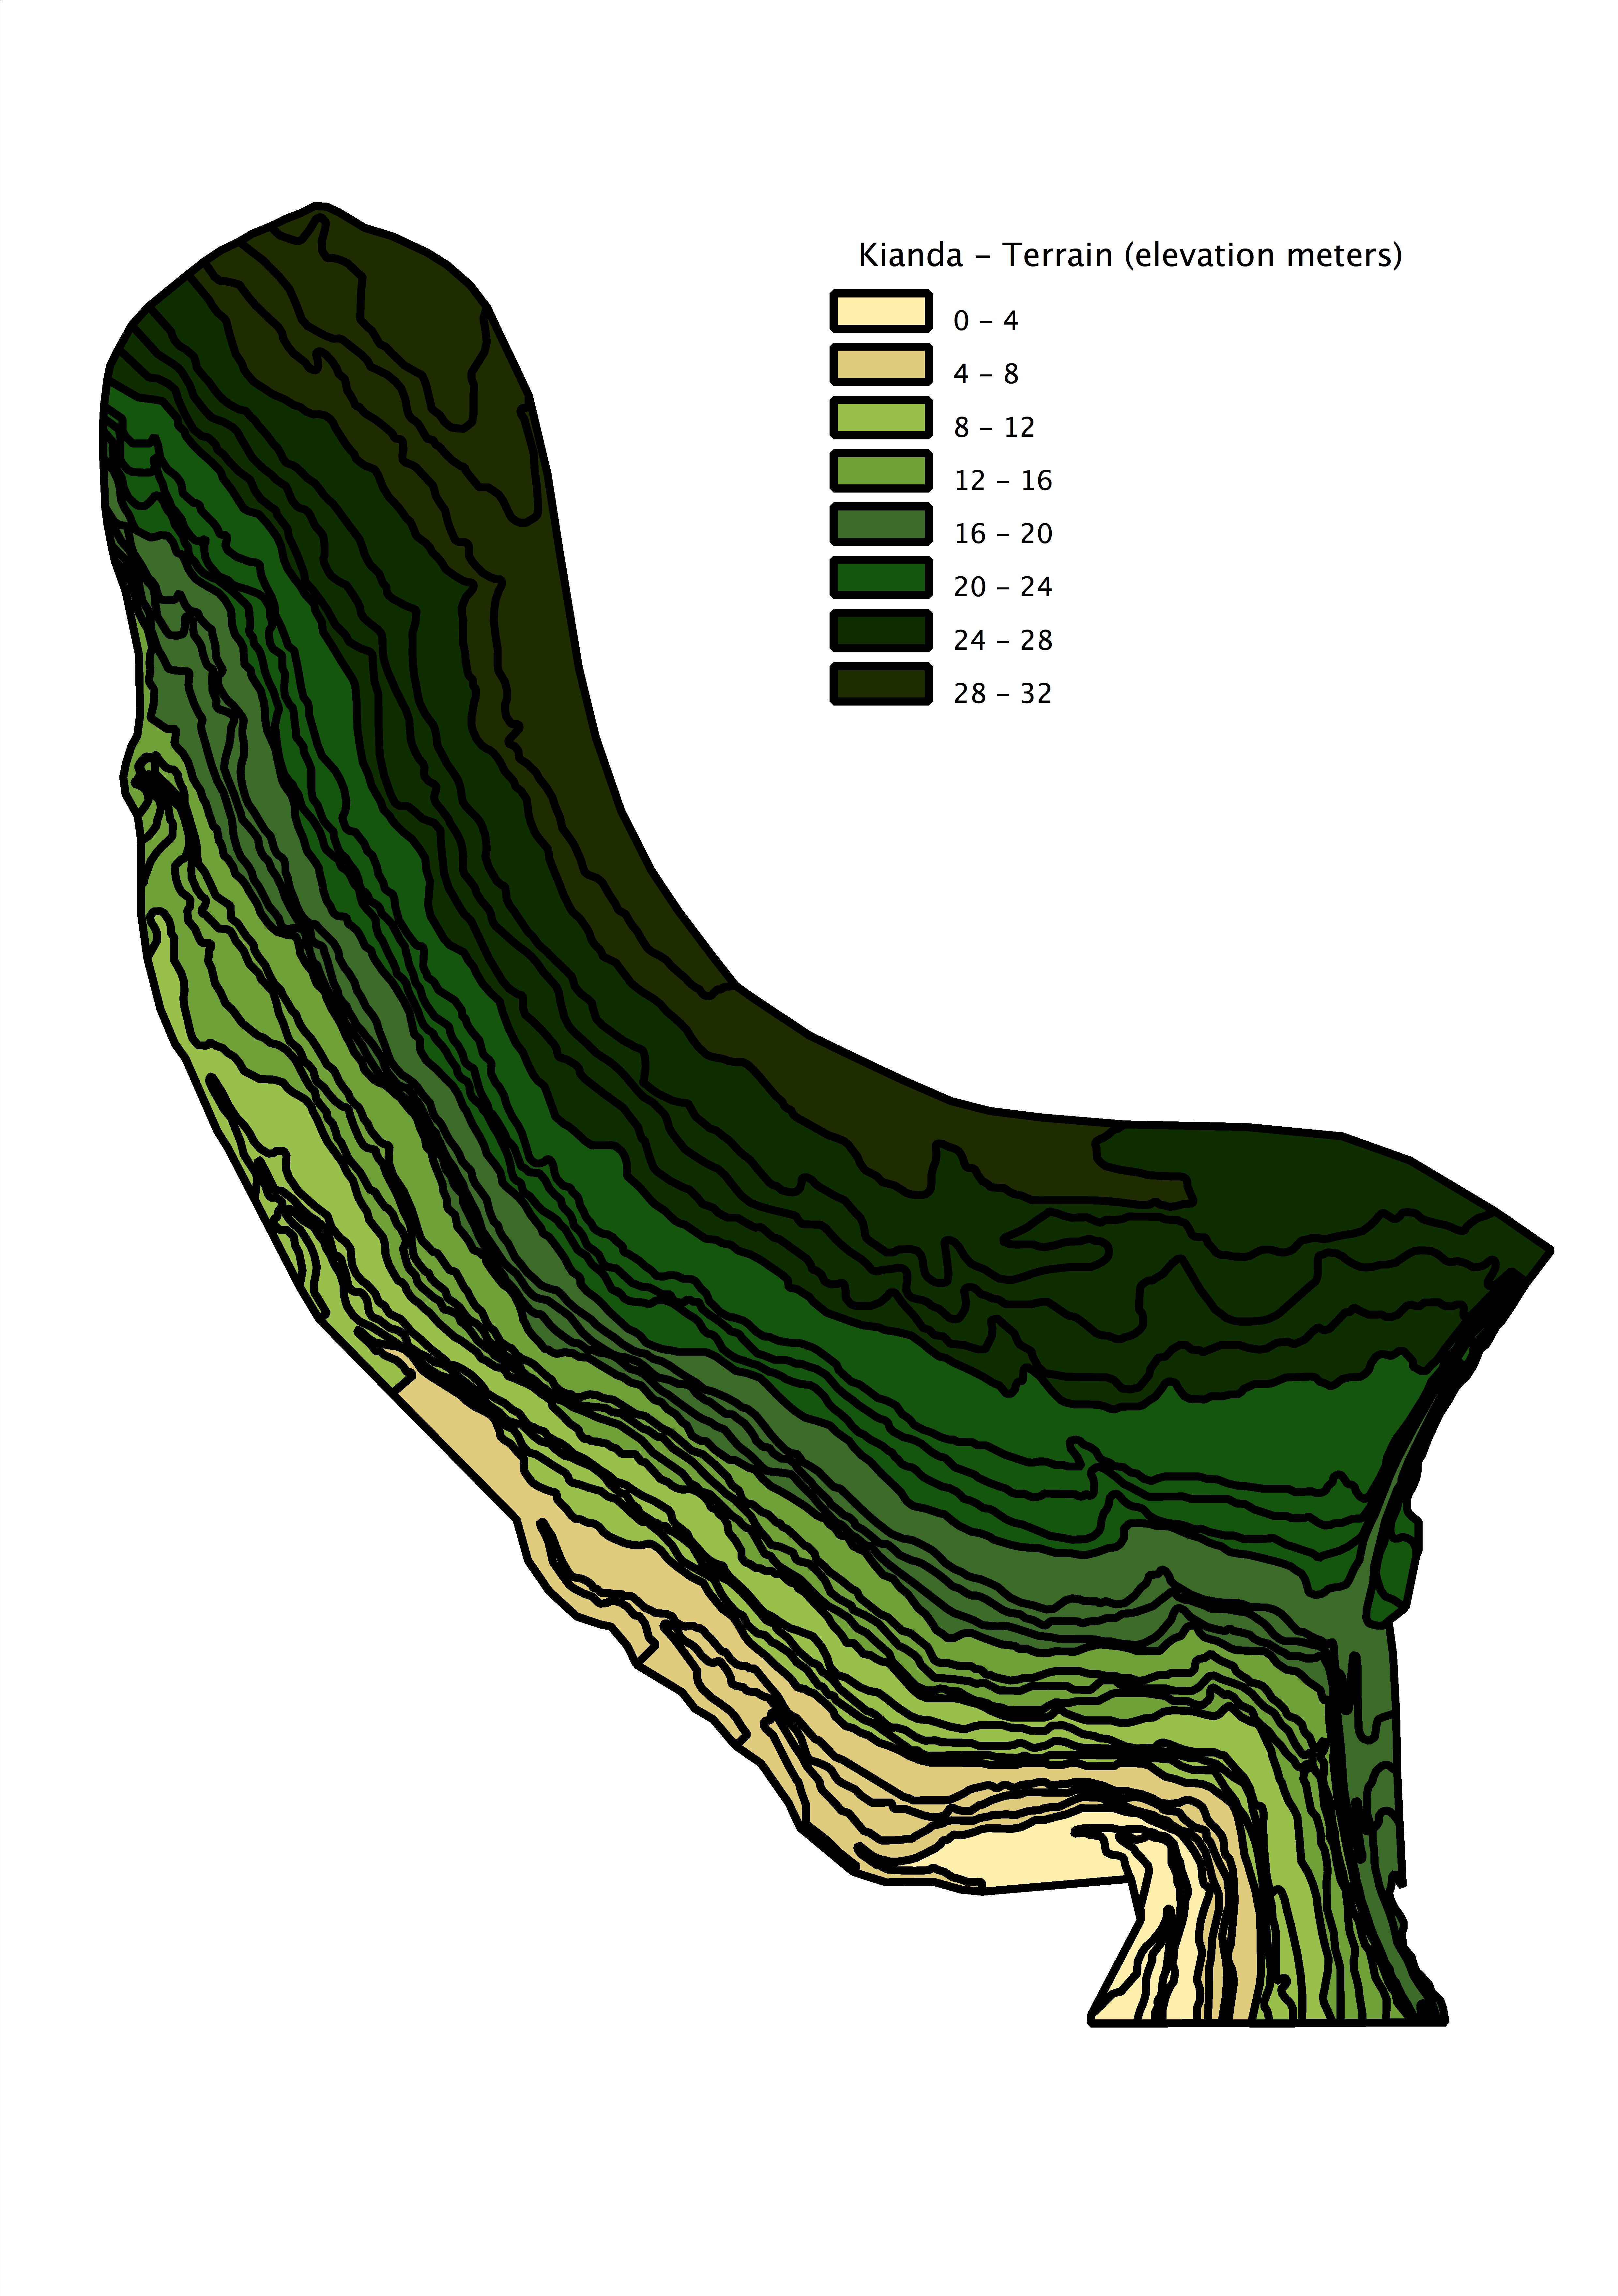
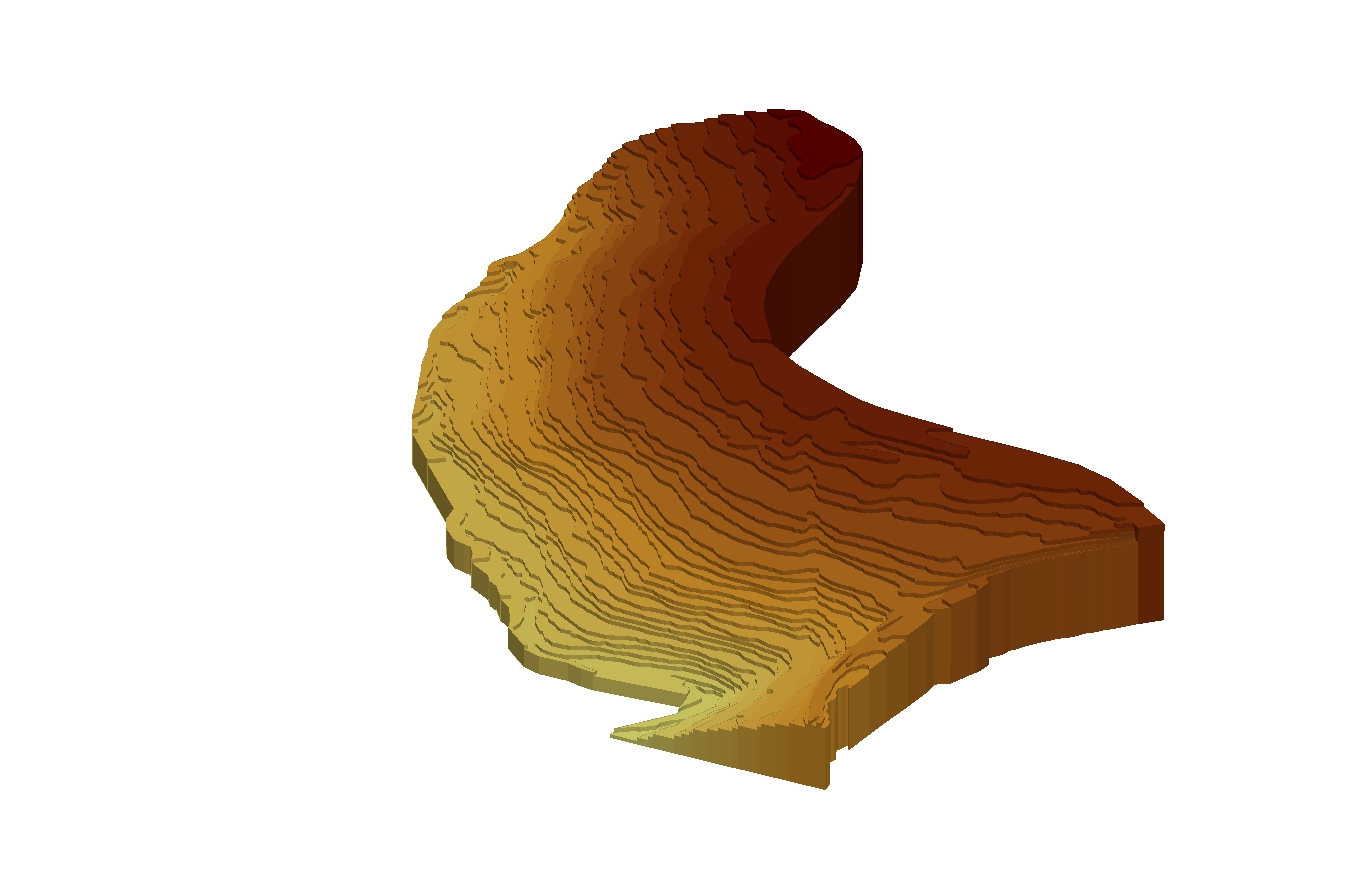
Topography
Village perimeter: 2 km
Village area: 0,16 sqKm
Maximum length (as the crow flies): 780 m
Minimum length (as the crow flies): 150 m
Highest point (above the see level): 1766 m
Lowest point (above the see level): 1736 m
Demographics
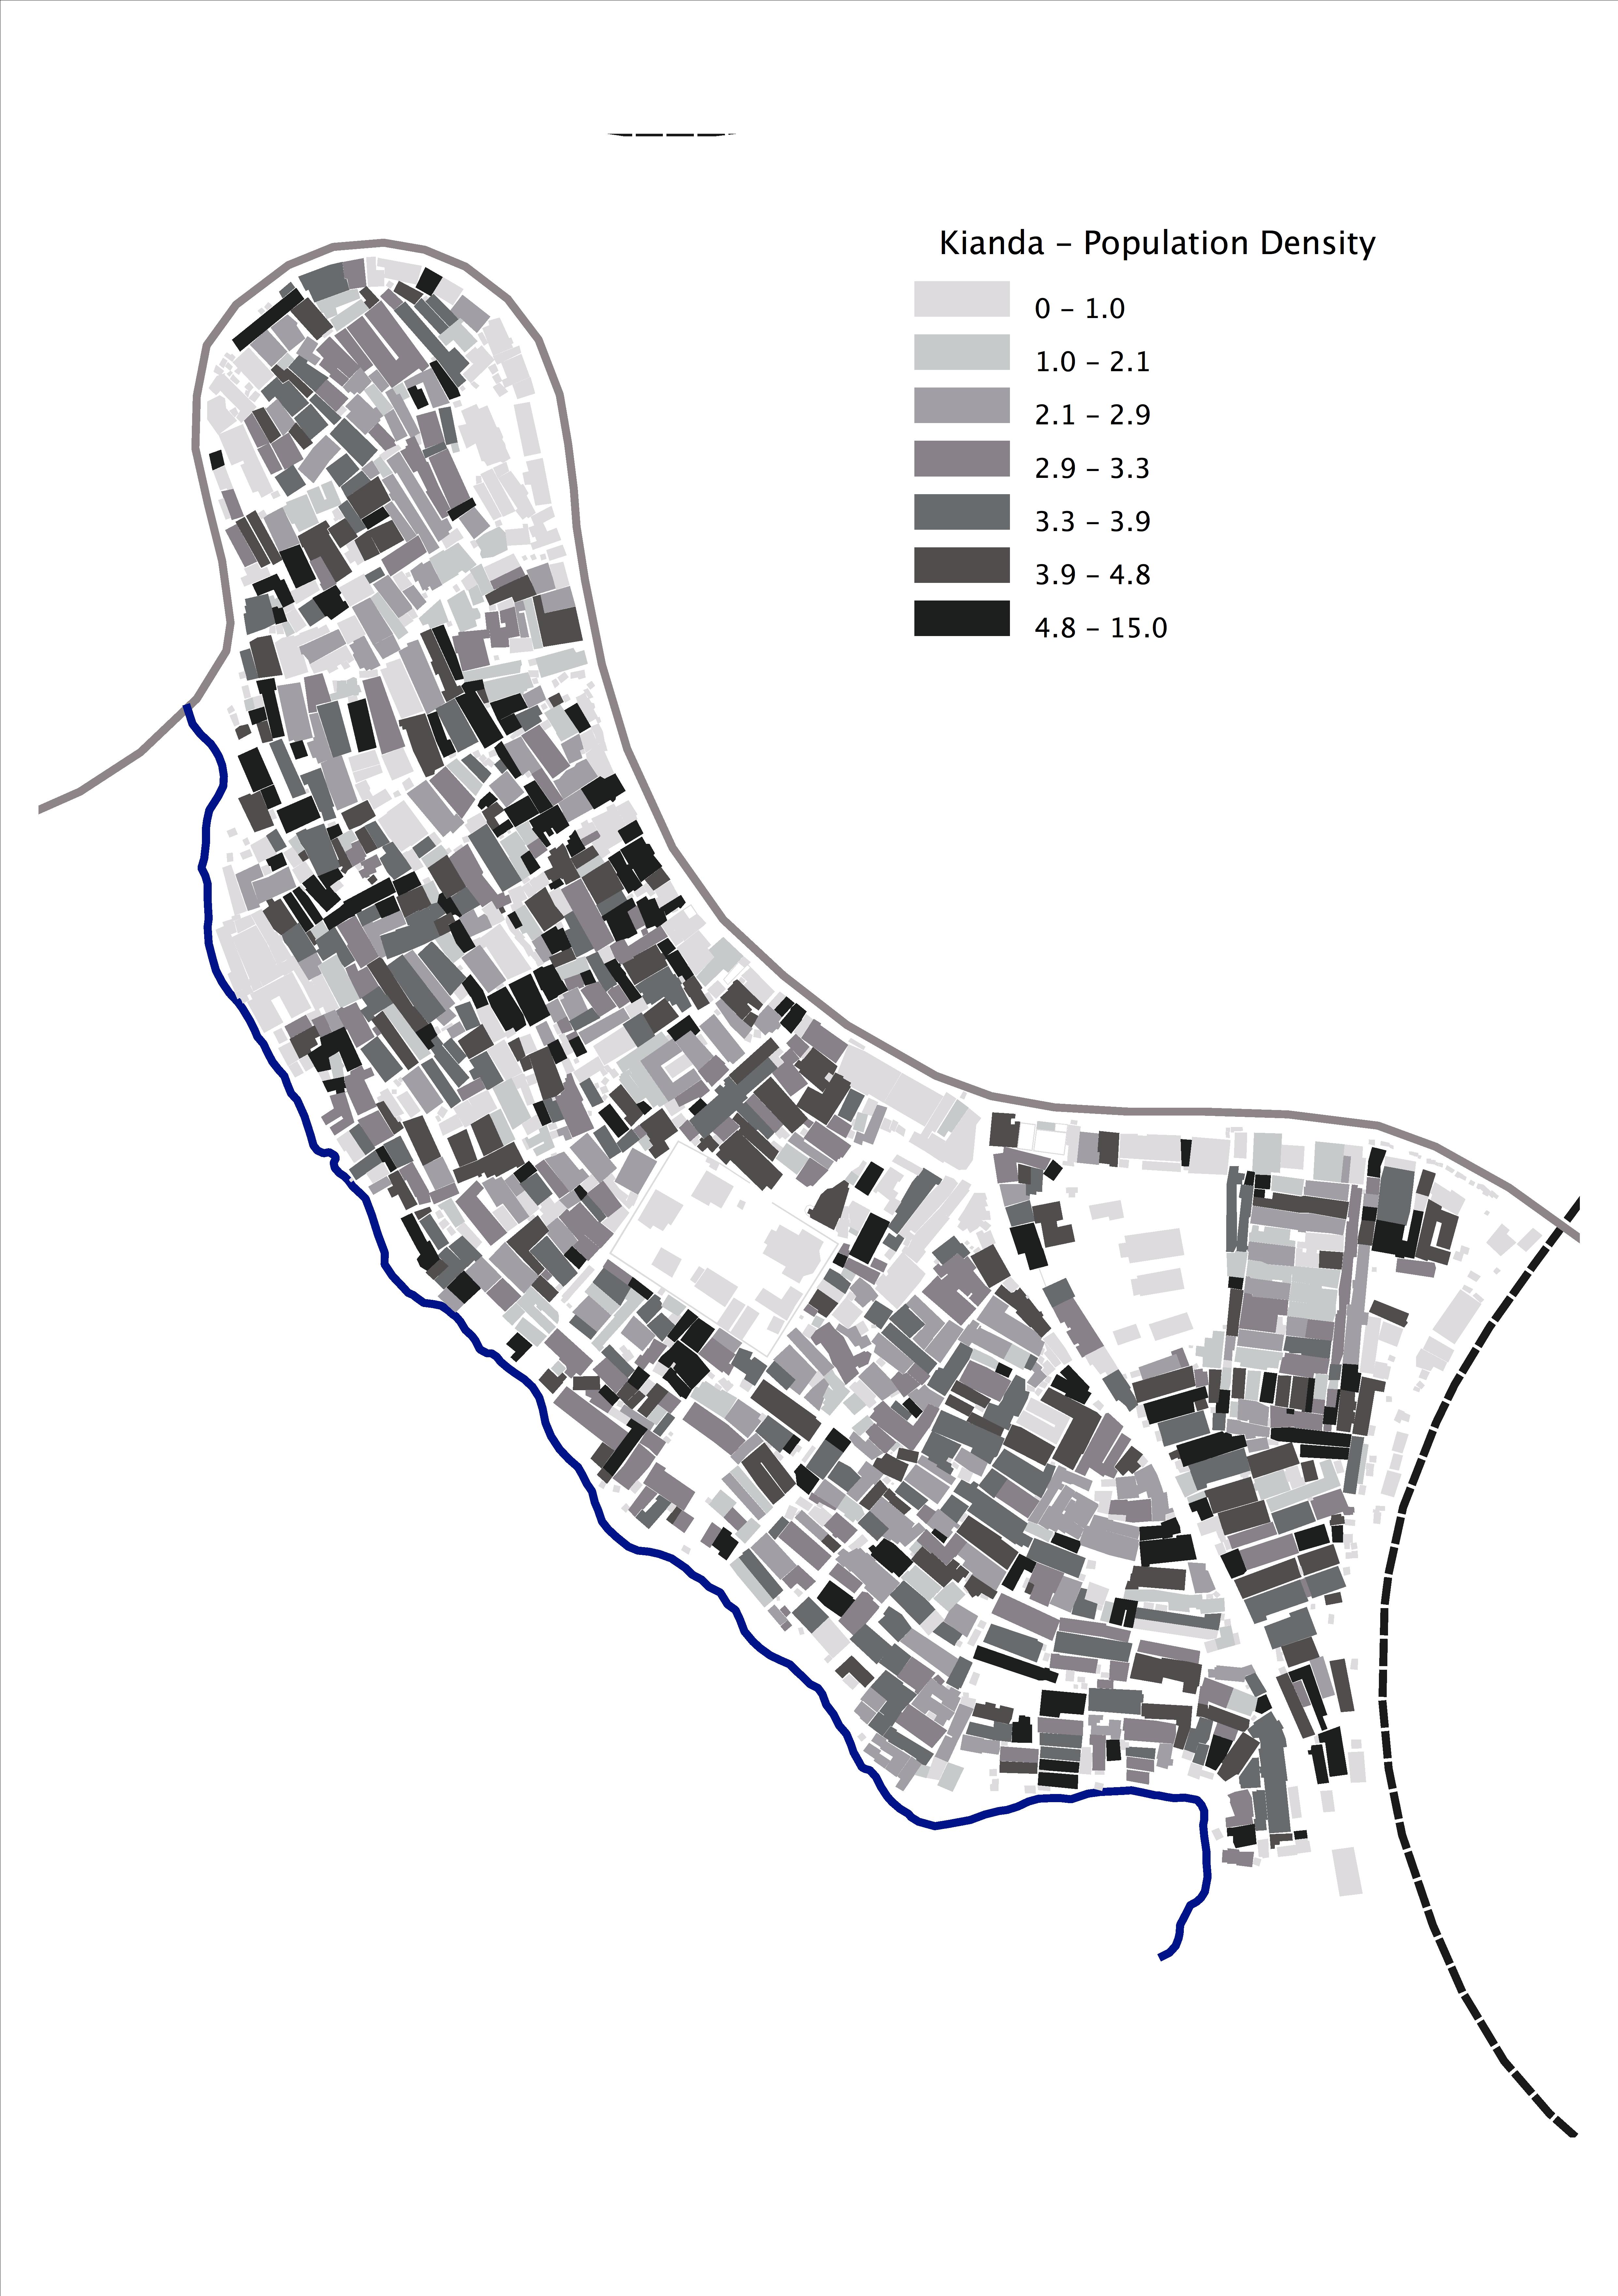
Population: 15,219
Density: 95,120 people per sq km
Estimated population in Kibera: 235,000-270,000 people
Families: 6.021 (2.5 people per family)
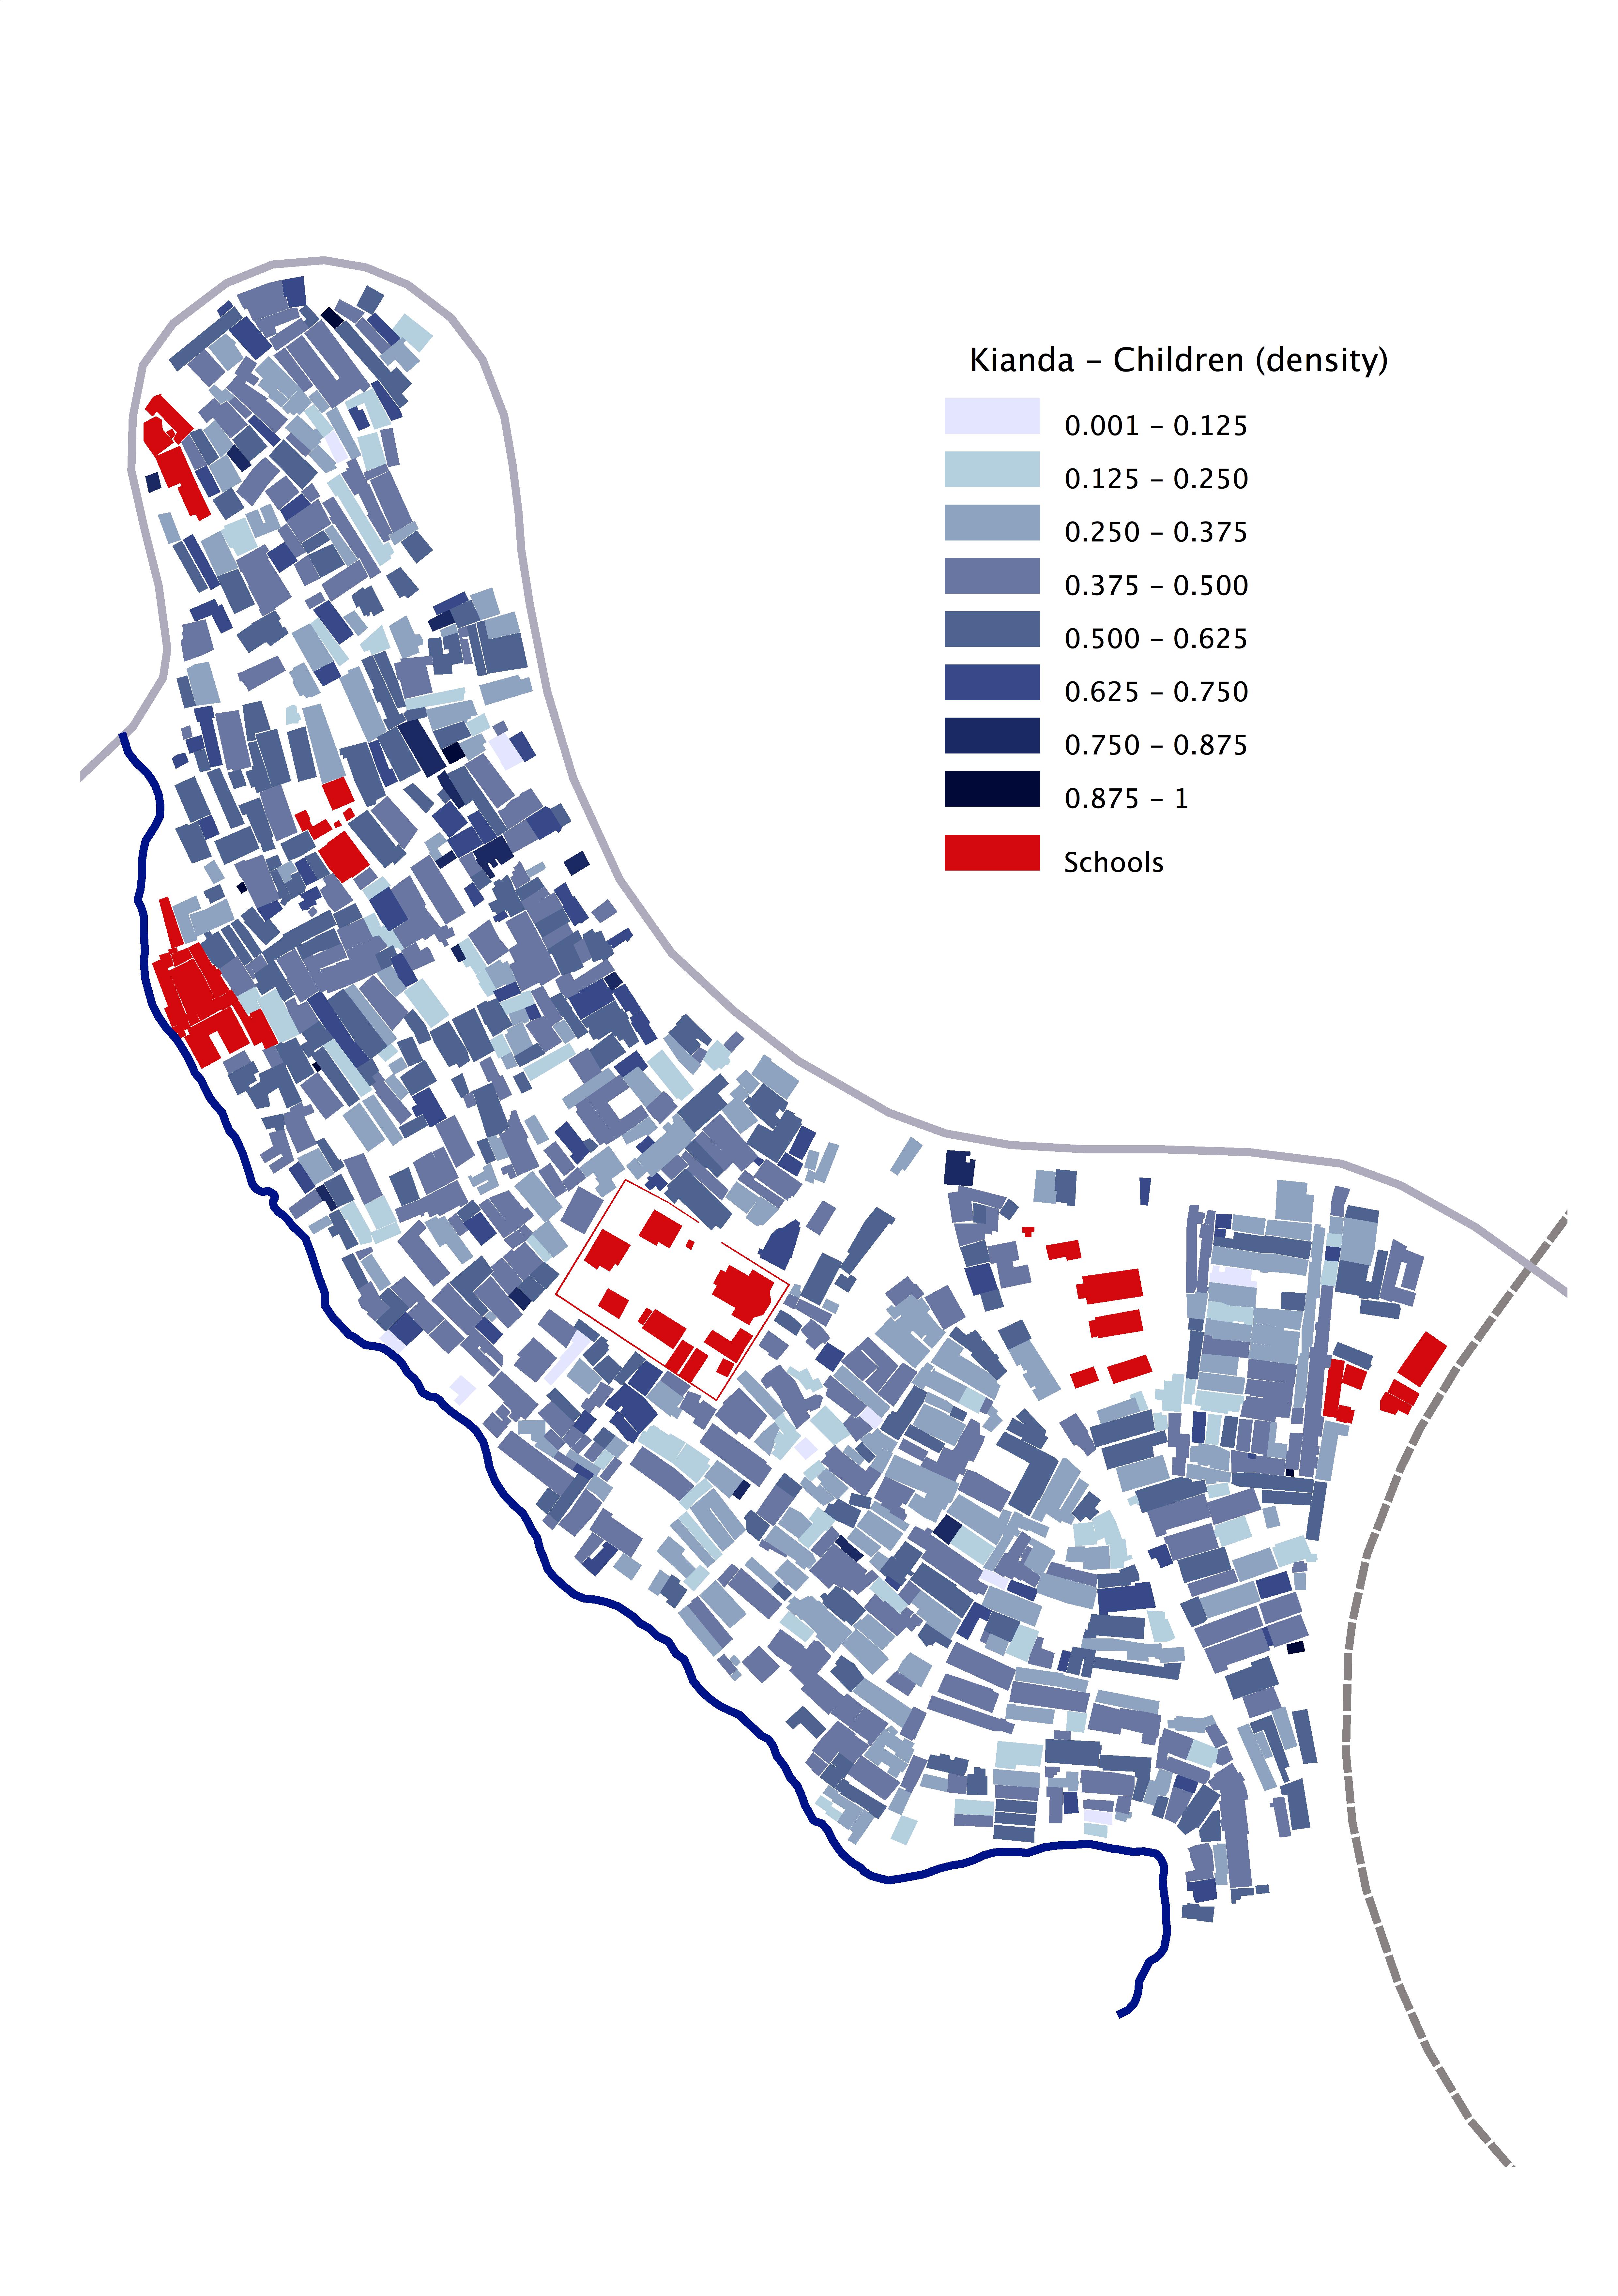
Children: 6,918 (45.5% of the population; 1.15 children per family)
Adults: 8,296 (54,5% of the population; 1.4 adults per family)
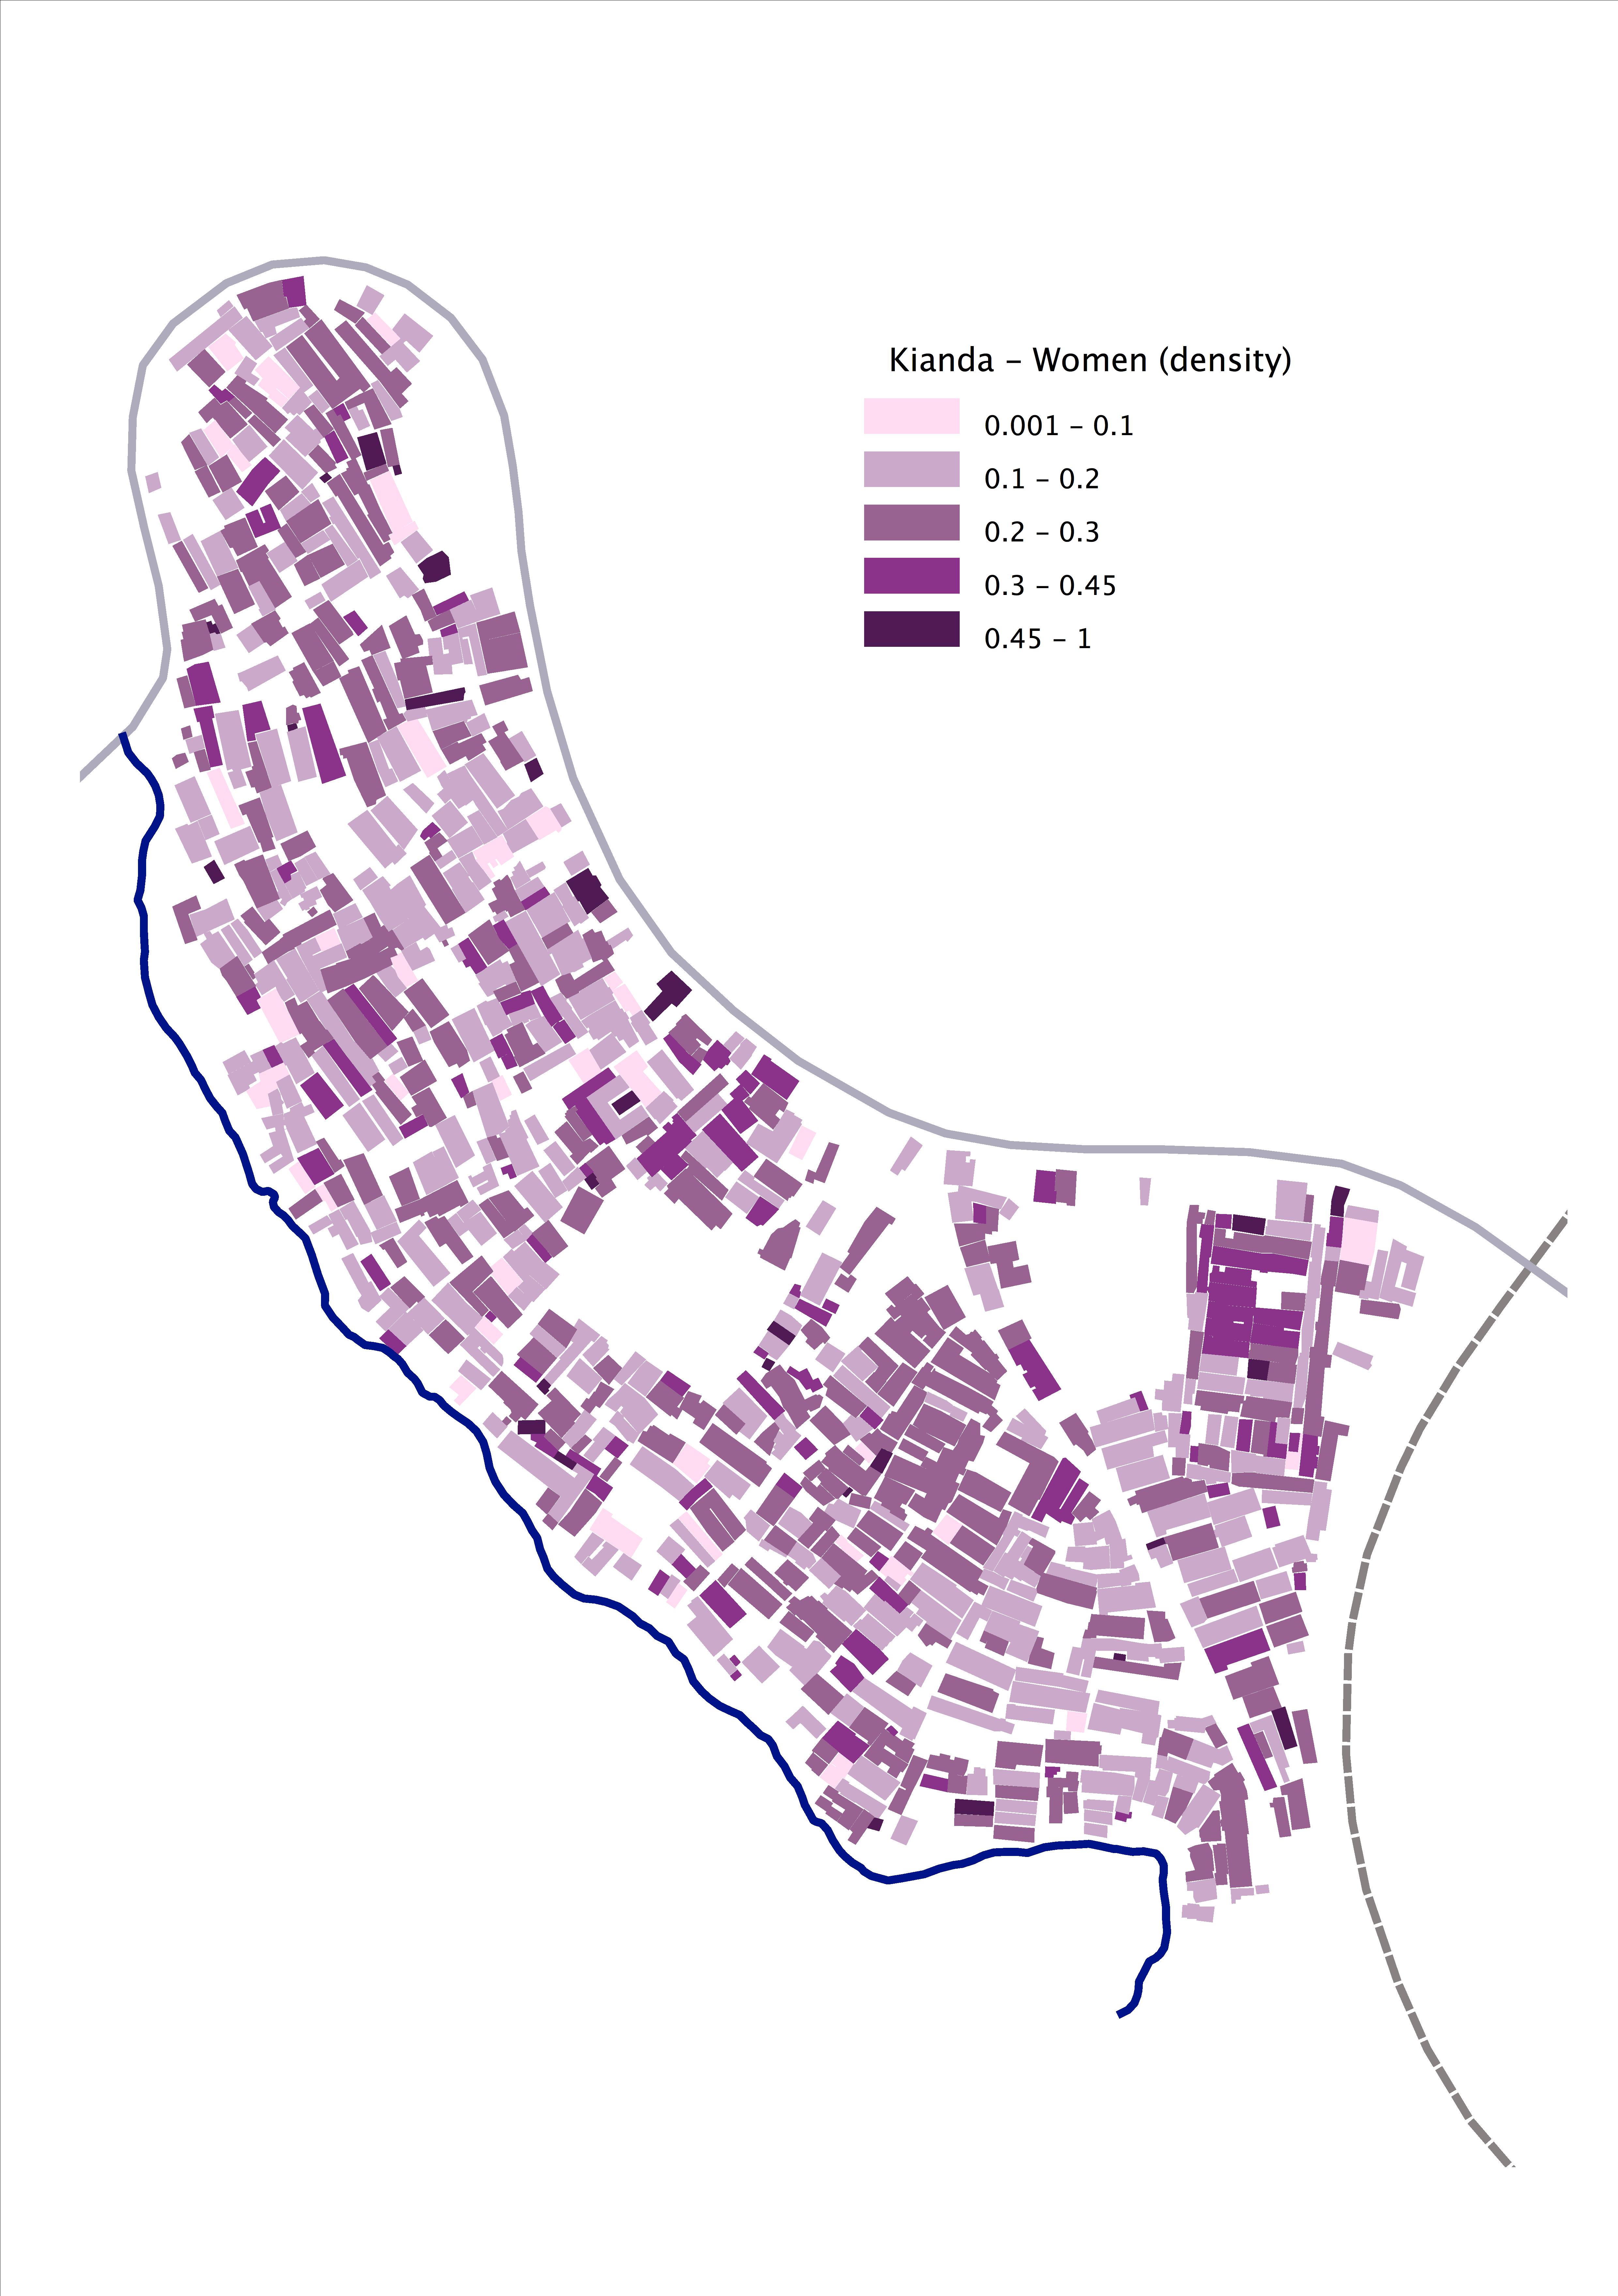
Women: 3,208 (21.1% of the pop.; 38.7% of adults)
Men: 5,088 (33.4% of the pop,; 61.3% of adults)
Married living in Kianda as a couple: 4,558 (54,9% of adults)
Married couples living in Kianda: 2,279
Married living alone in Kianda: 531 (6.4%)
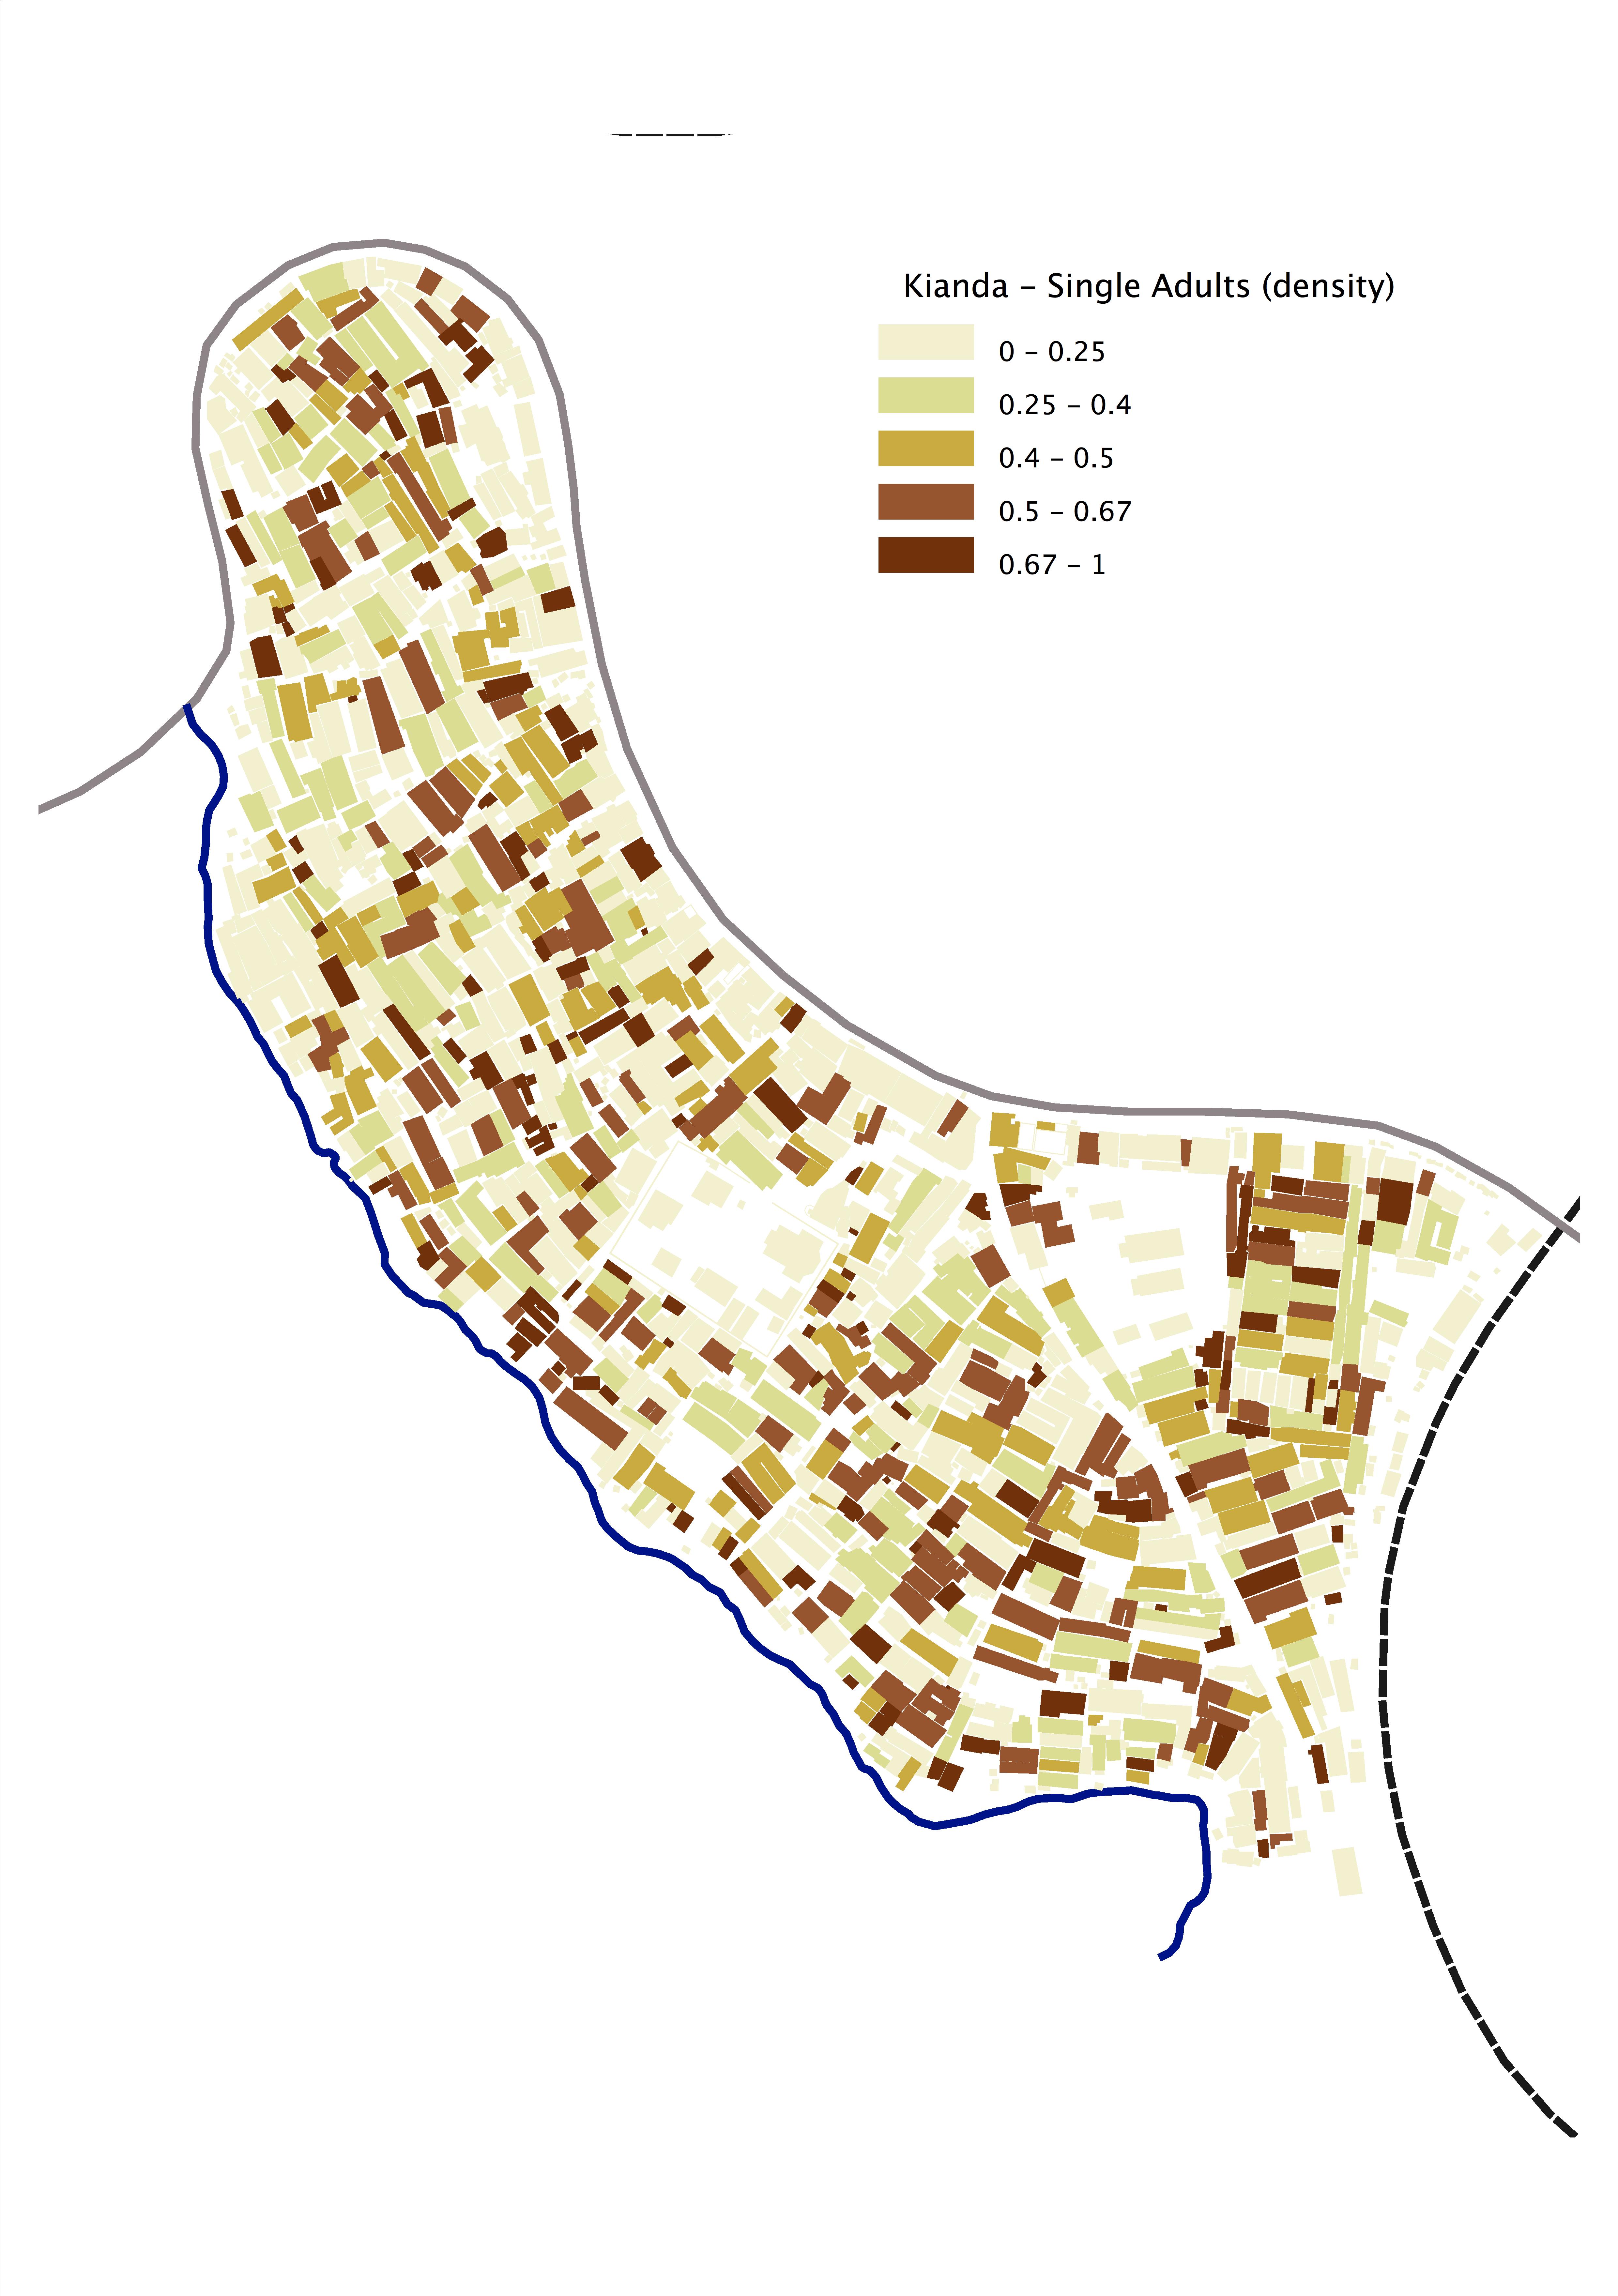
Single: 2,689 (32.4%)
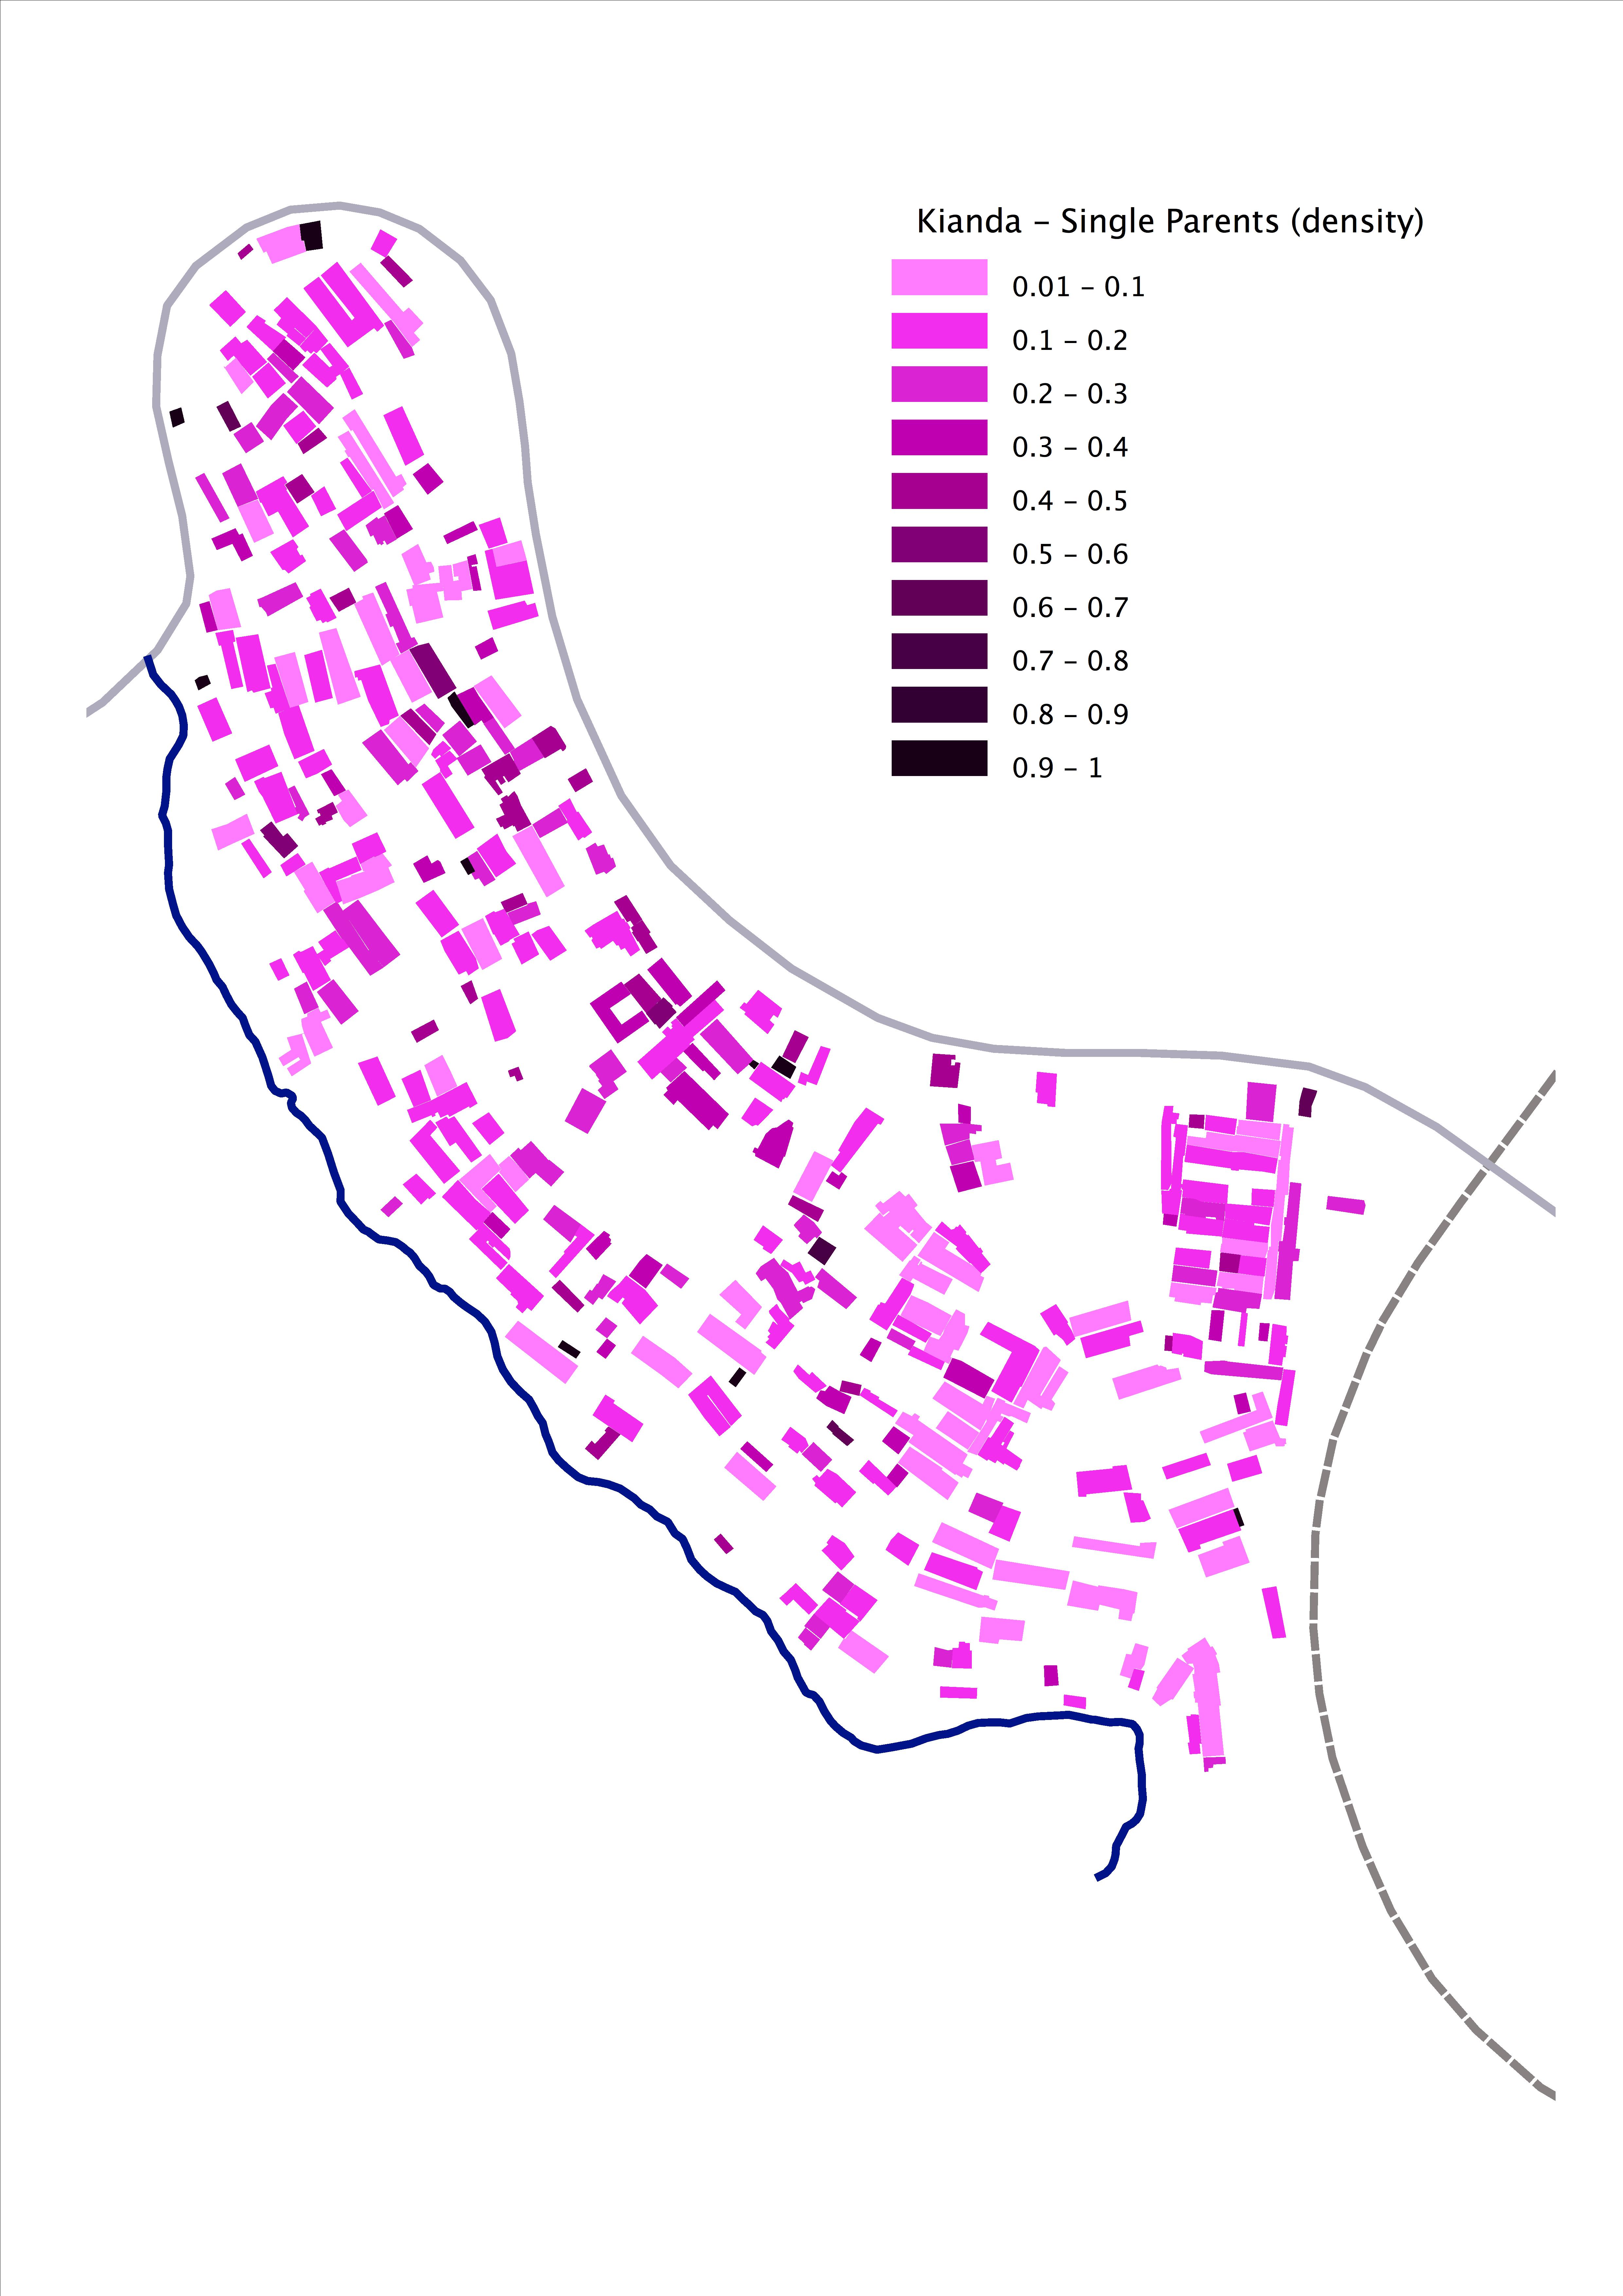
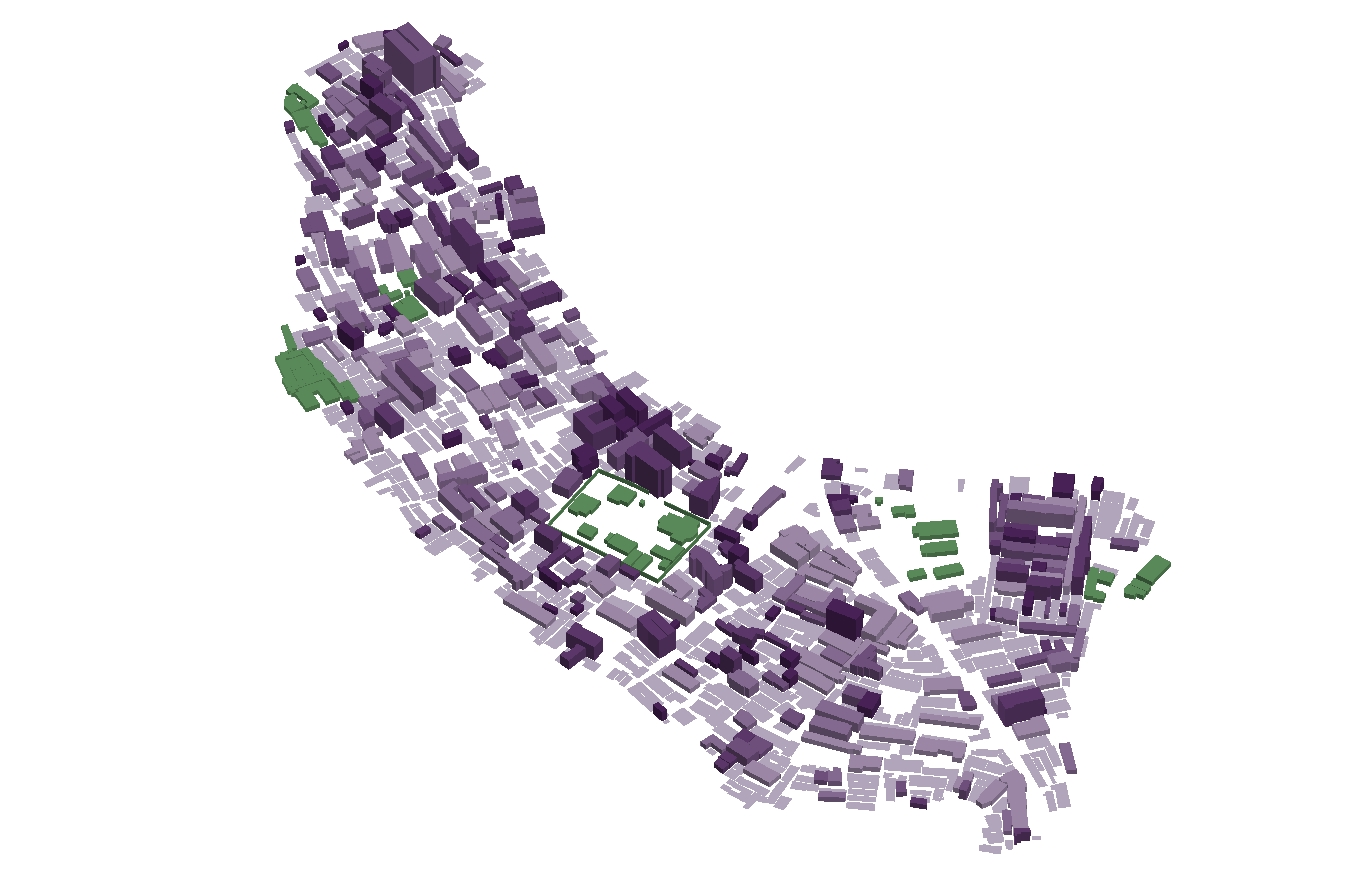
Single parents: 518 (6.24%)
Tribes (number of families)
Luo: 2,196 (36.5%)
Kisii: 689 (11.5%)
Luhya: 661 (11.0%)
Kamba: 427 (7.1%)
Gikuyu: 247 (4.1%)
Other tribes or unknown: 1,801 (29.8%)
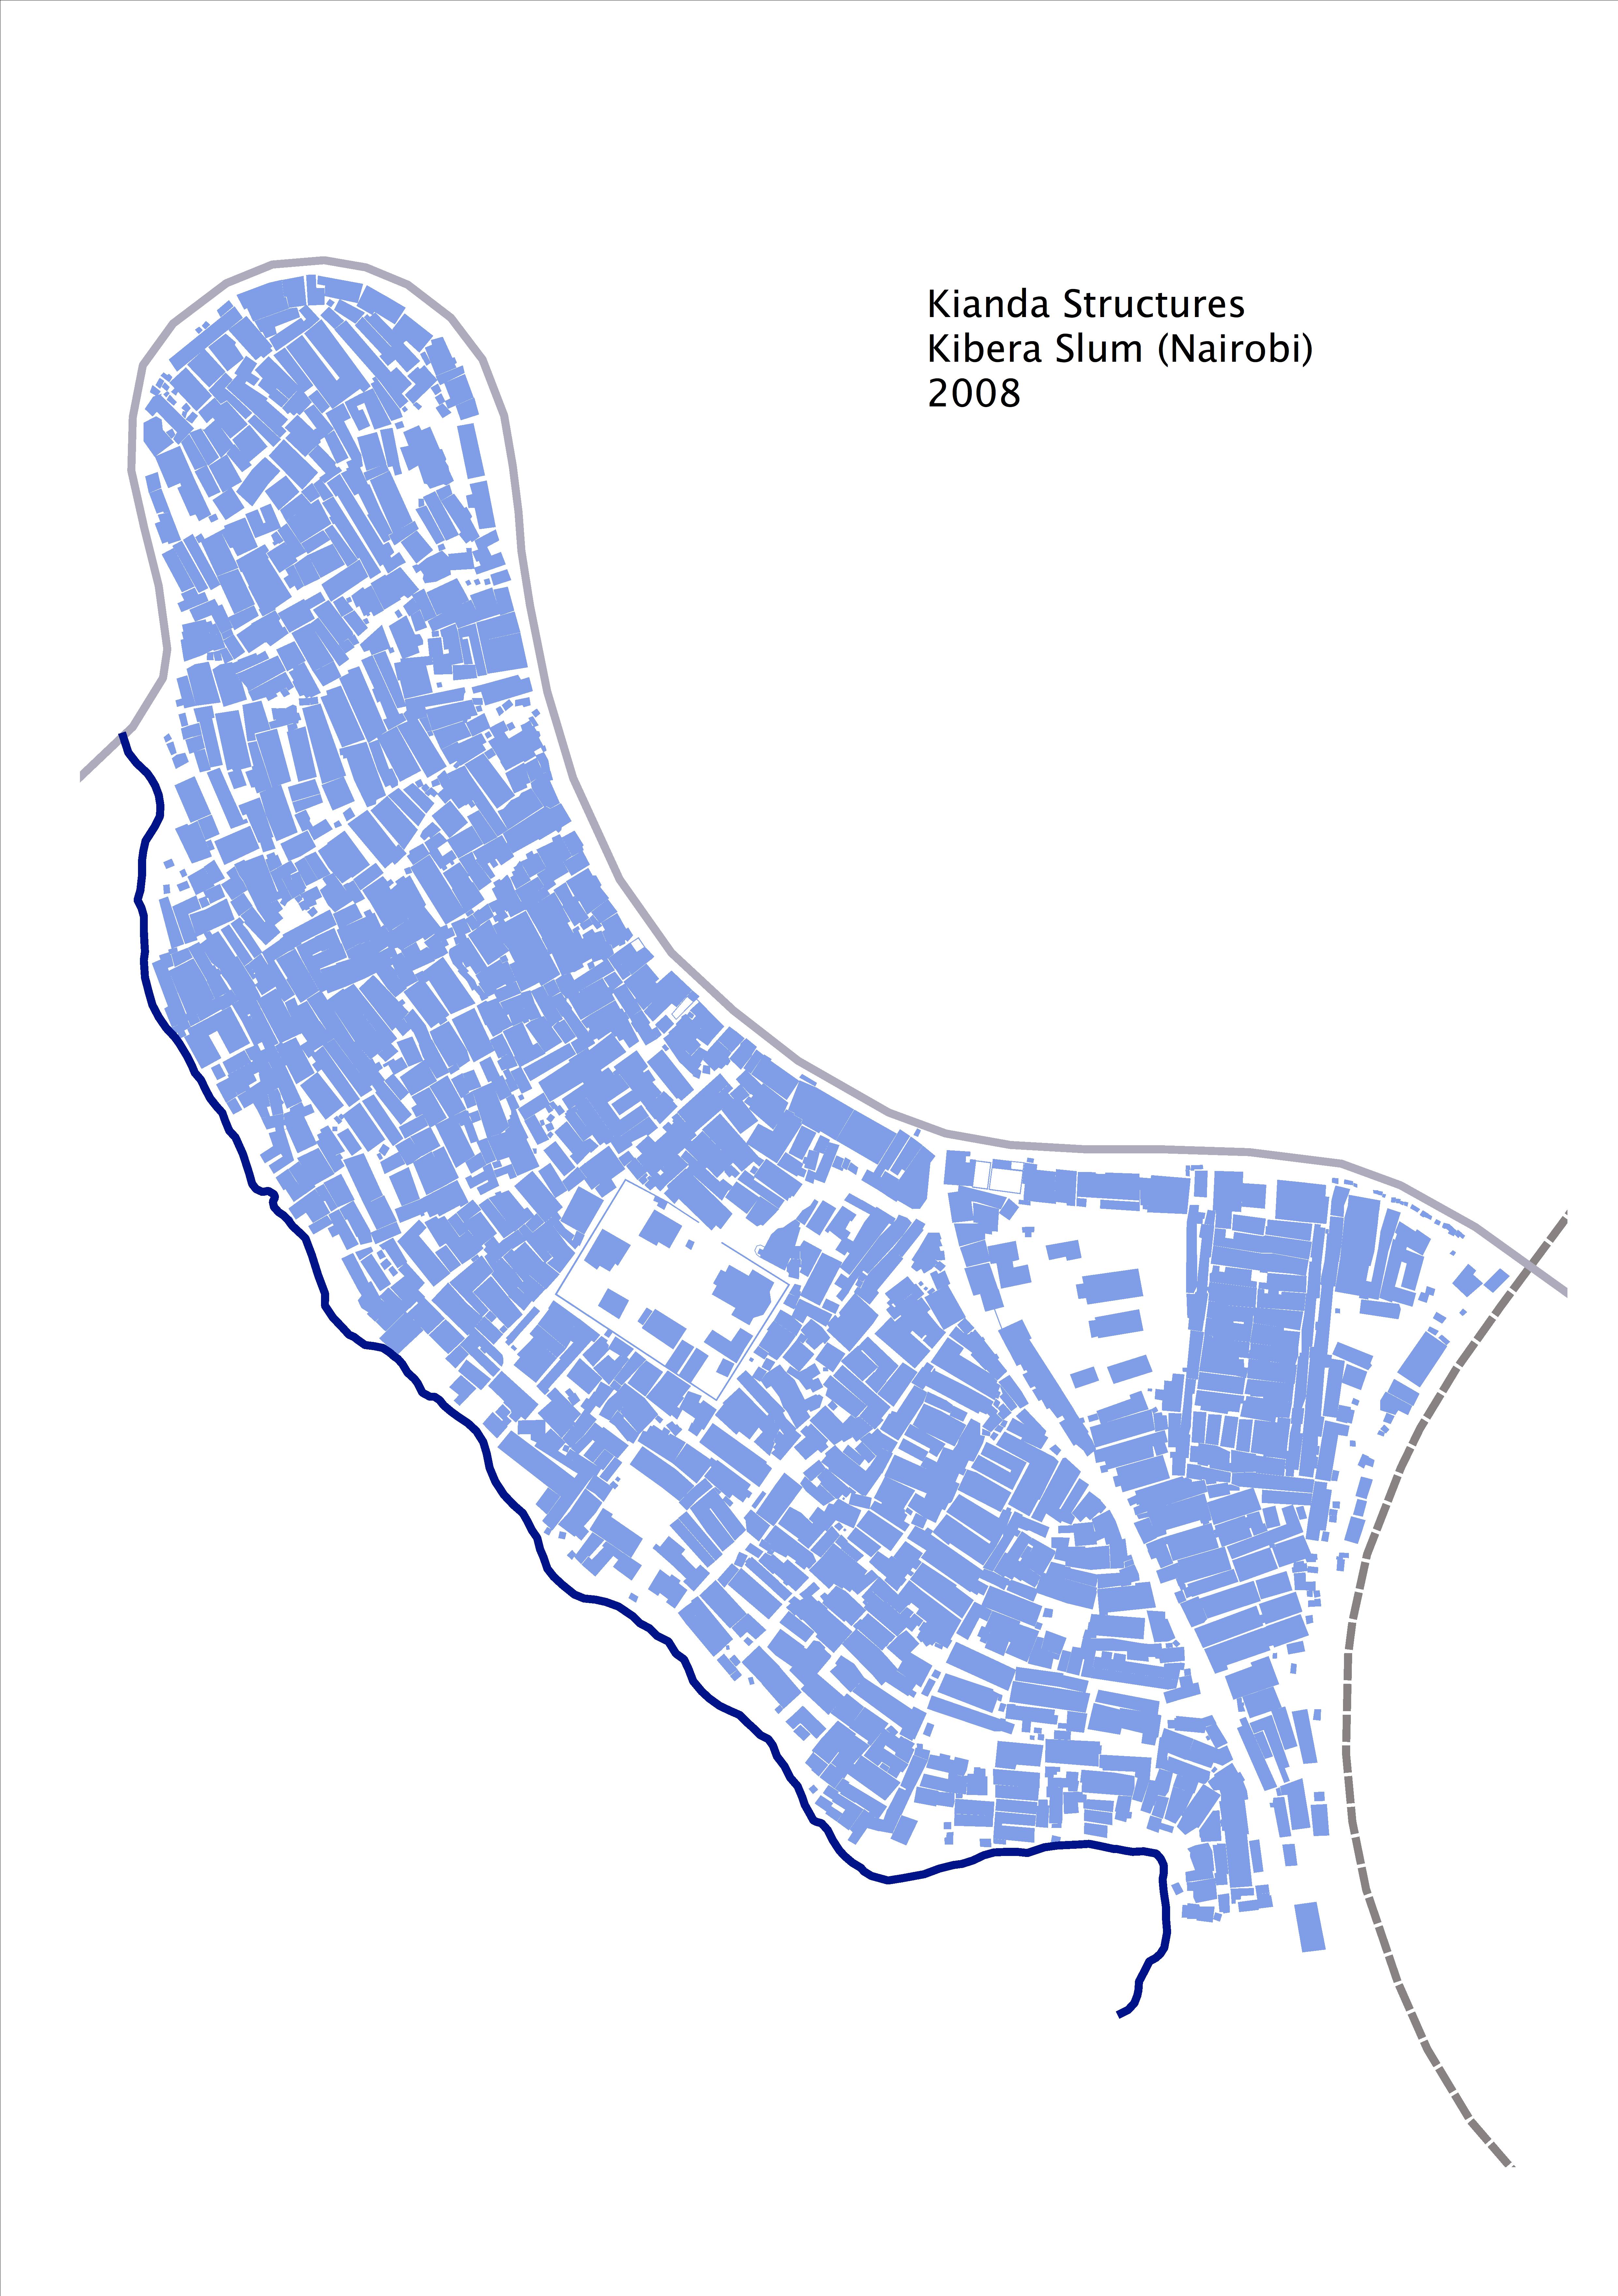
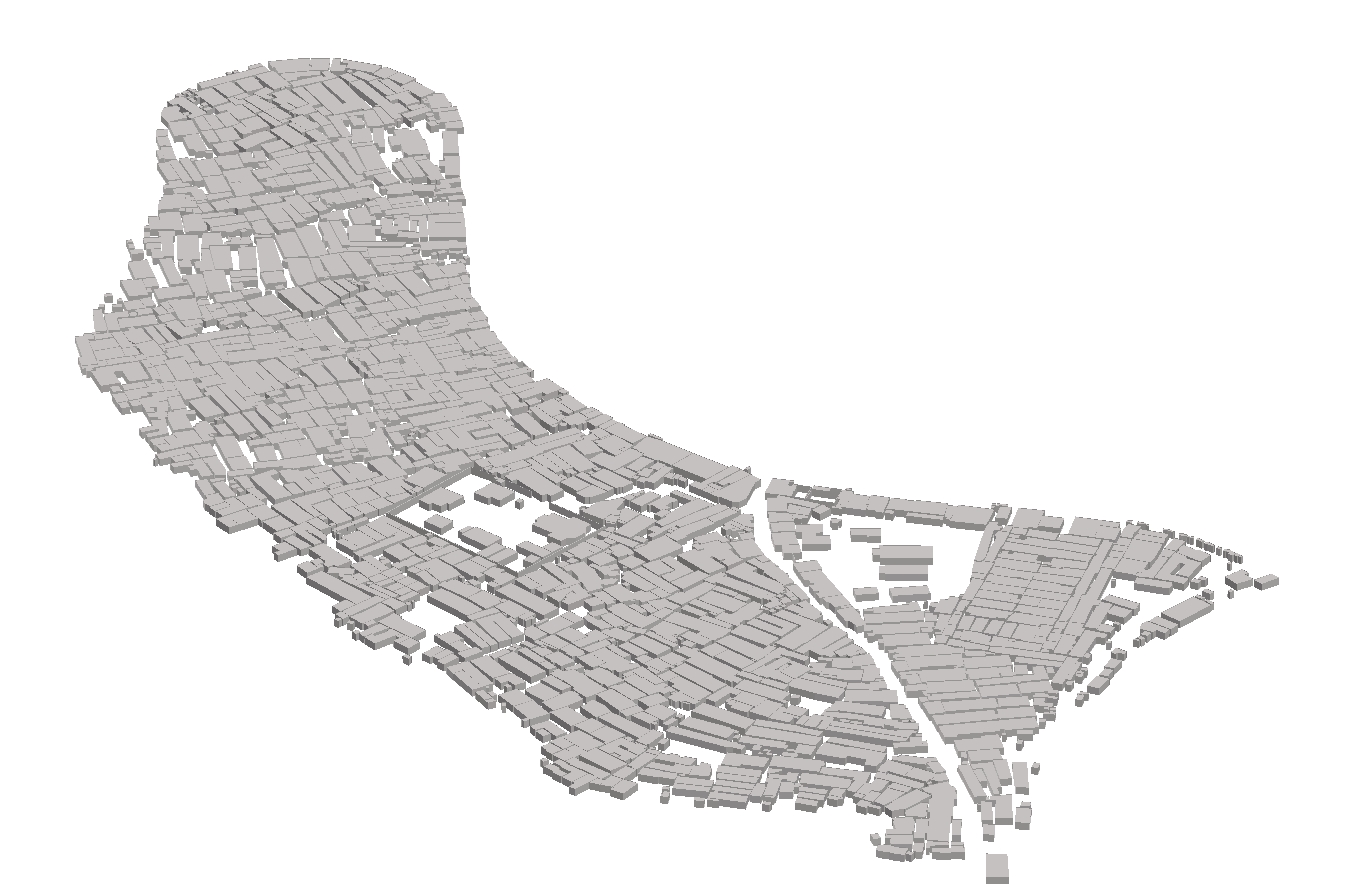
Structures
Structures: 1,510
Main: 1,225
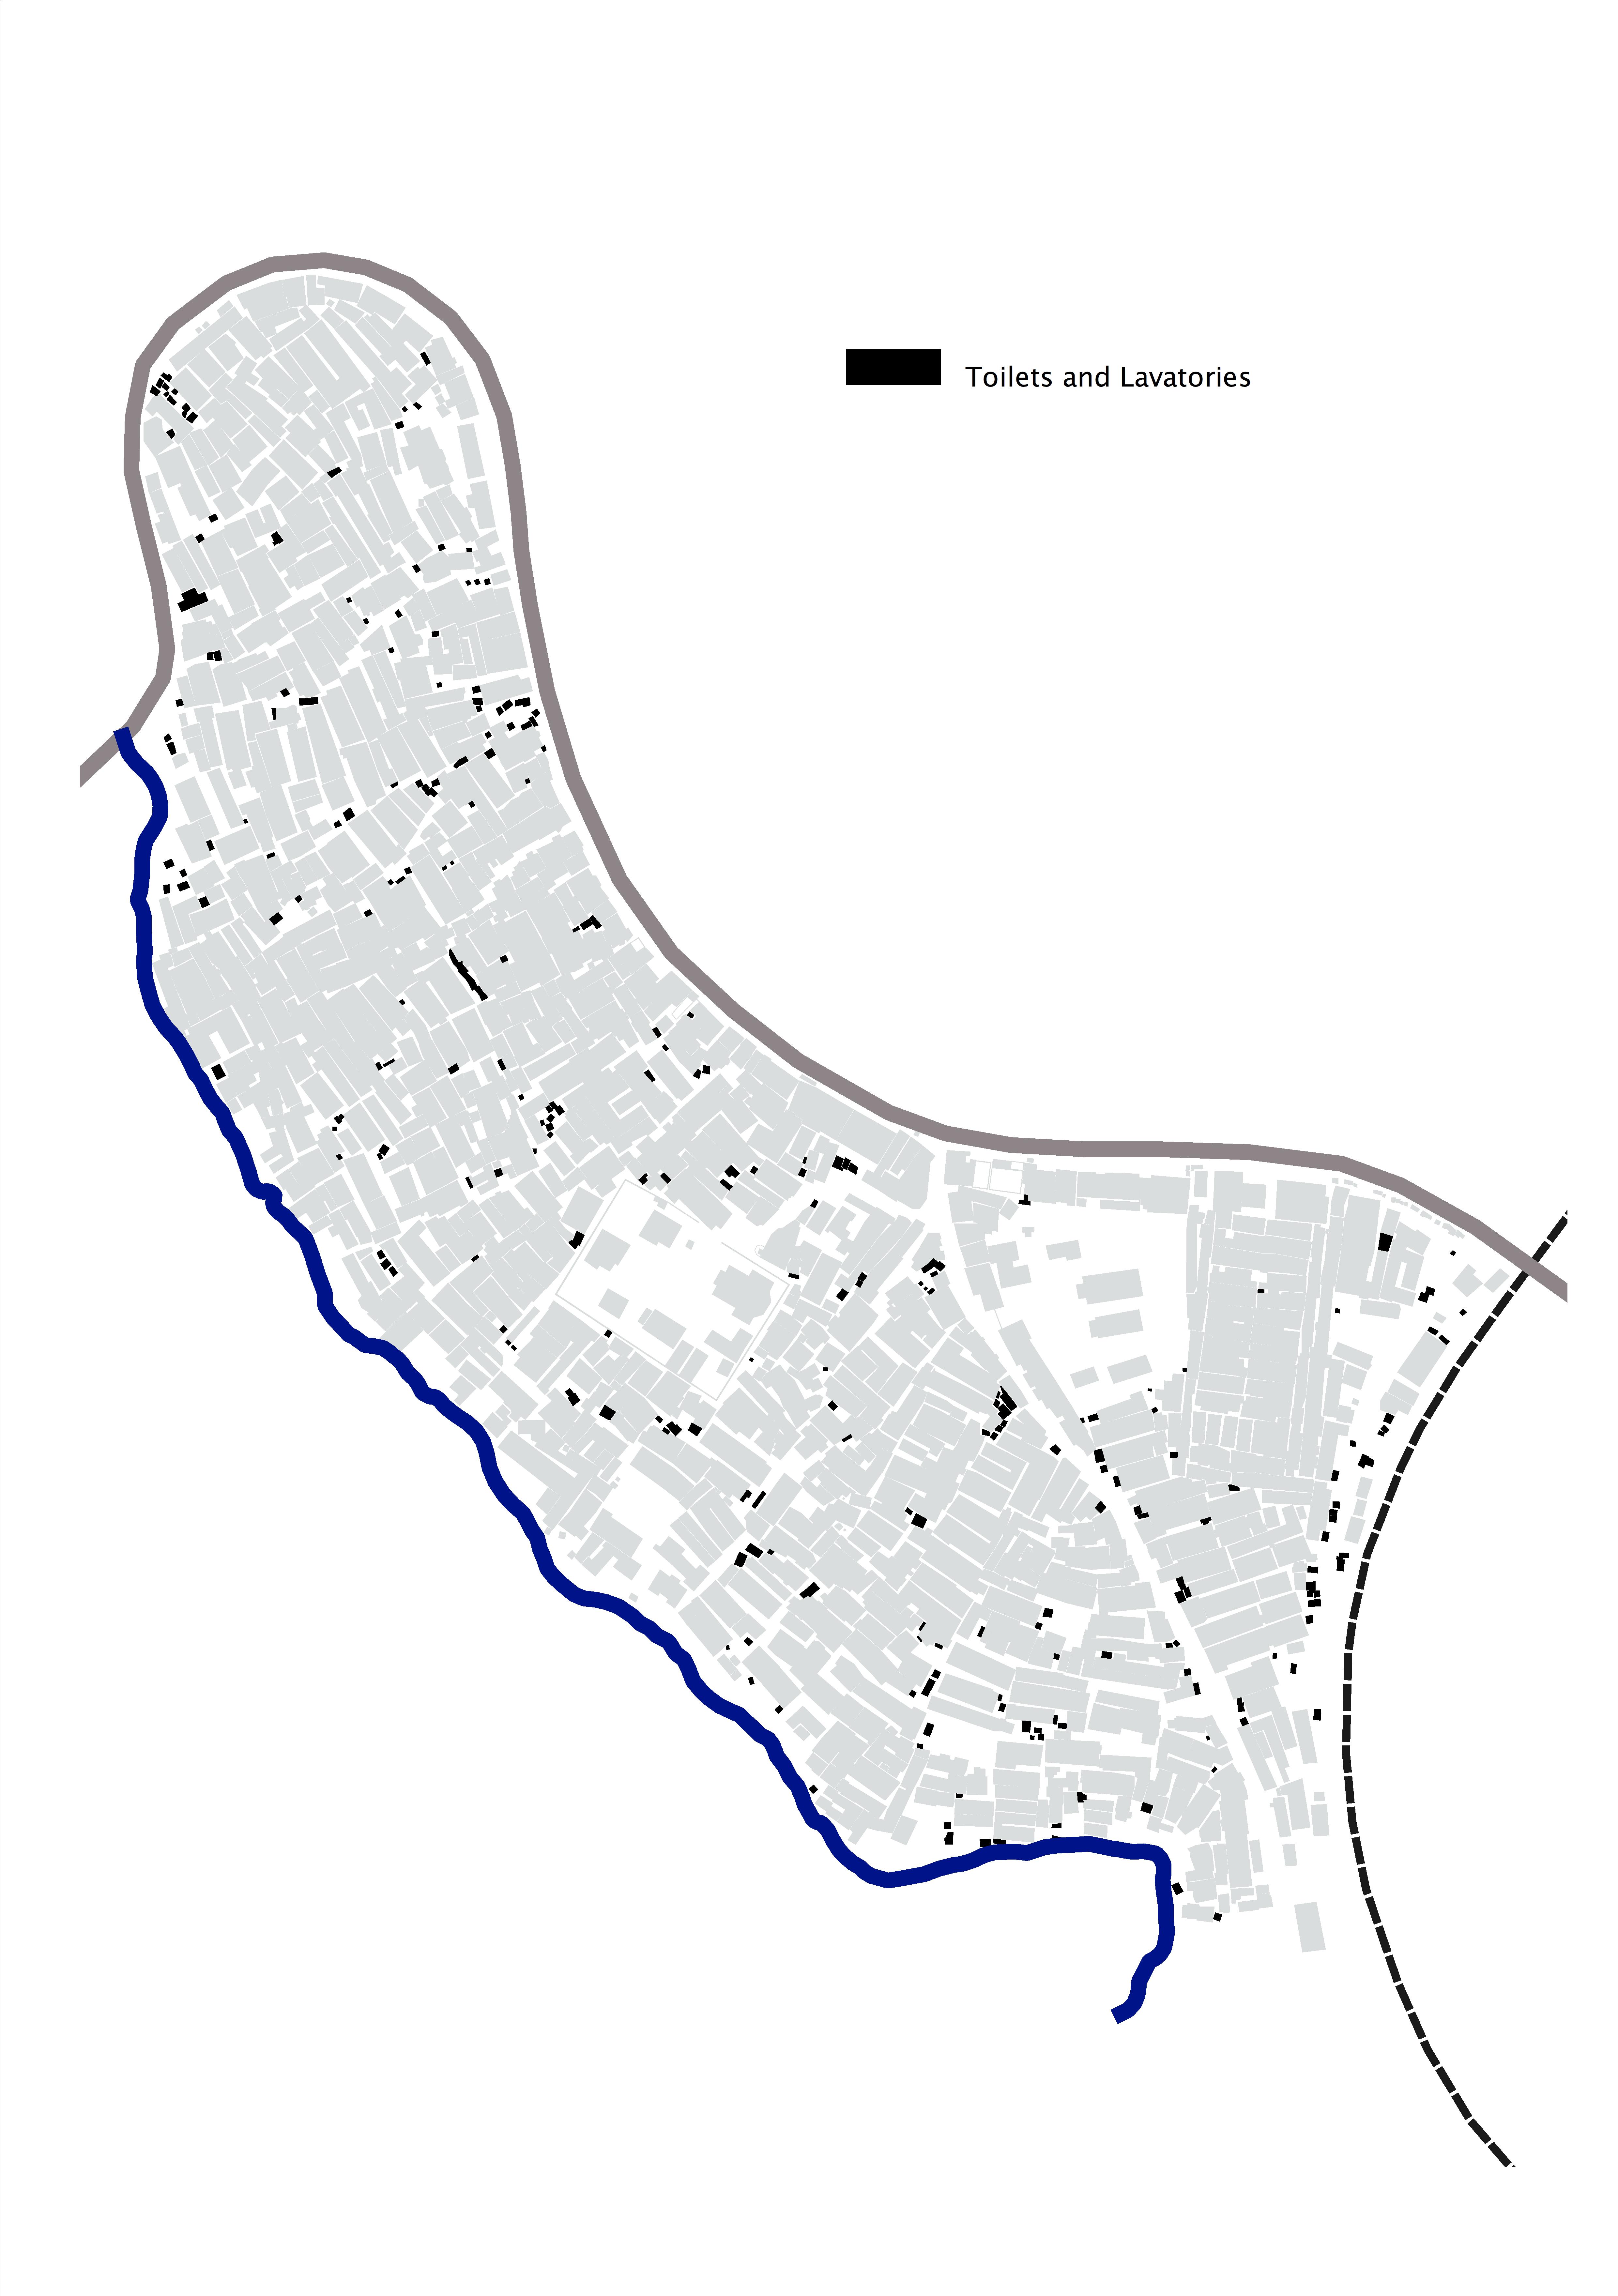
Secondary (toilets, lavatories): 285 (1 lavatory or toilet served 53 people)
Units (within main structures): 4,998 (4.1 units in each main structure)
Household units: 4,560 (91.2%)
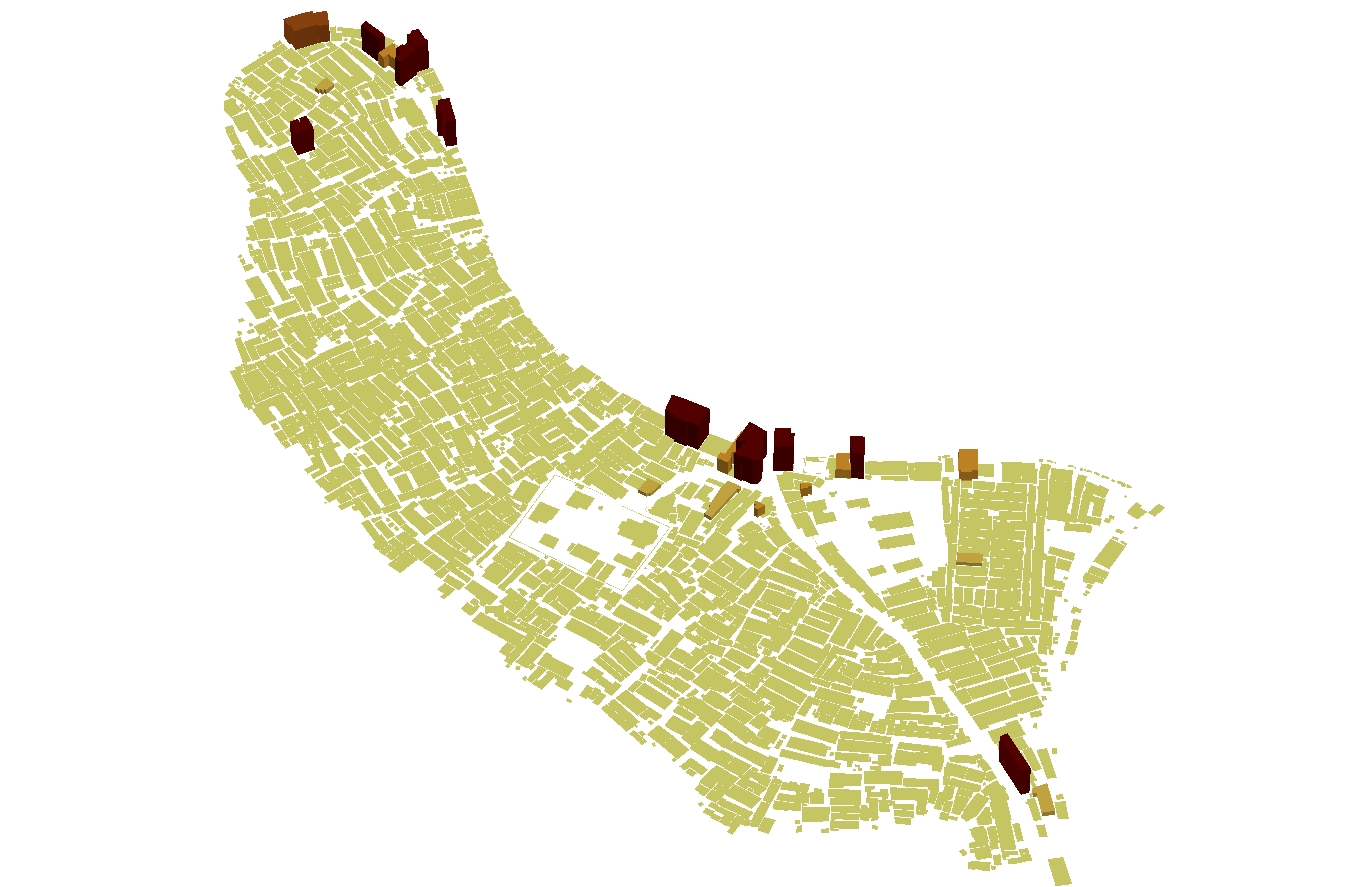
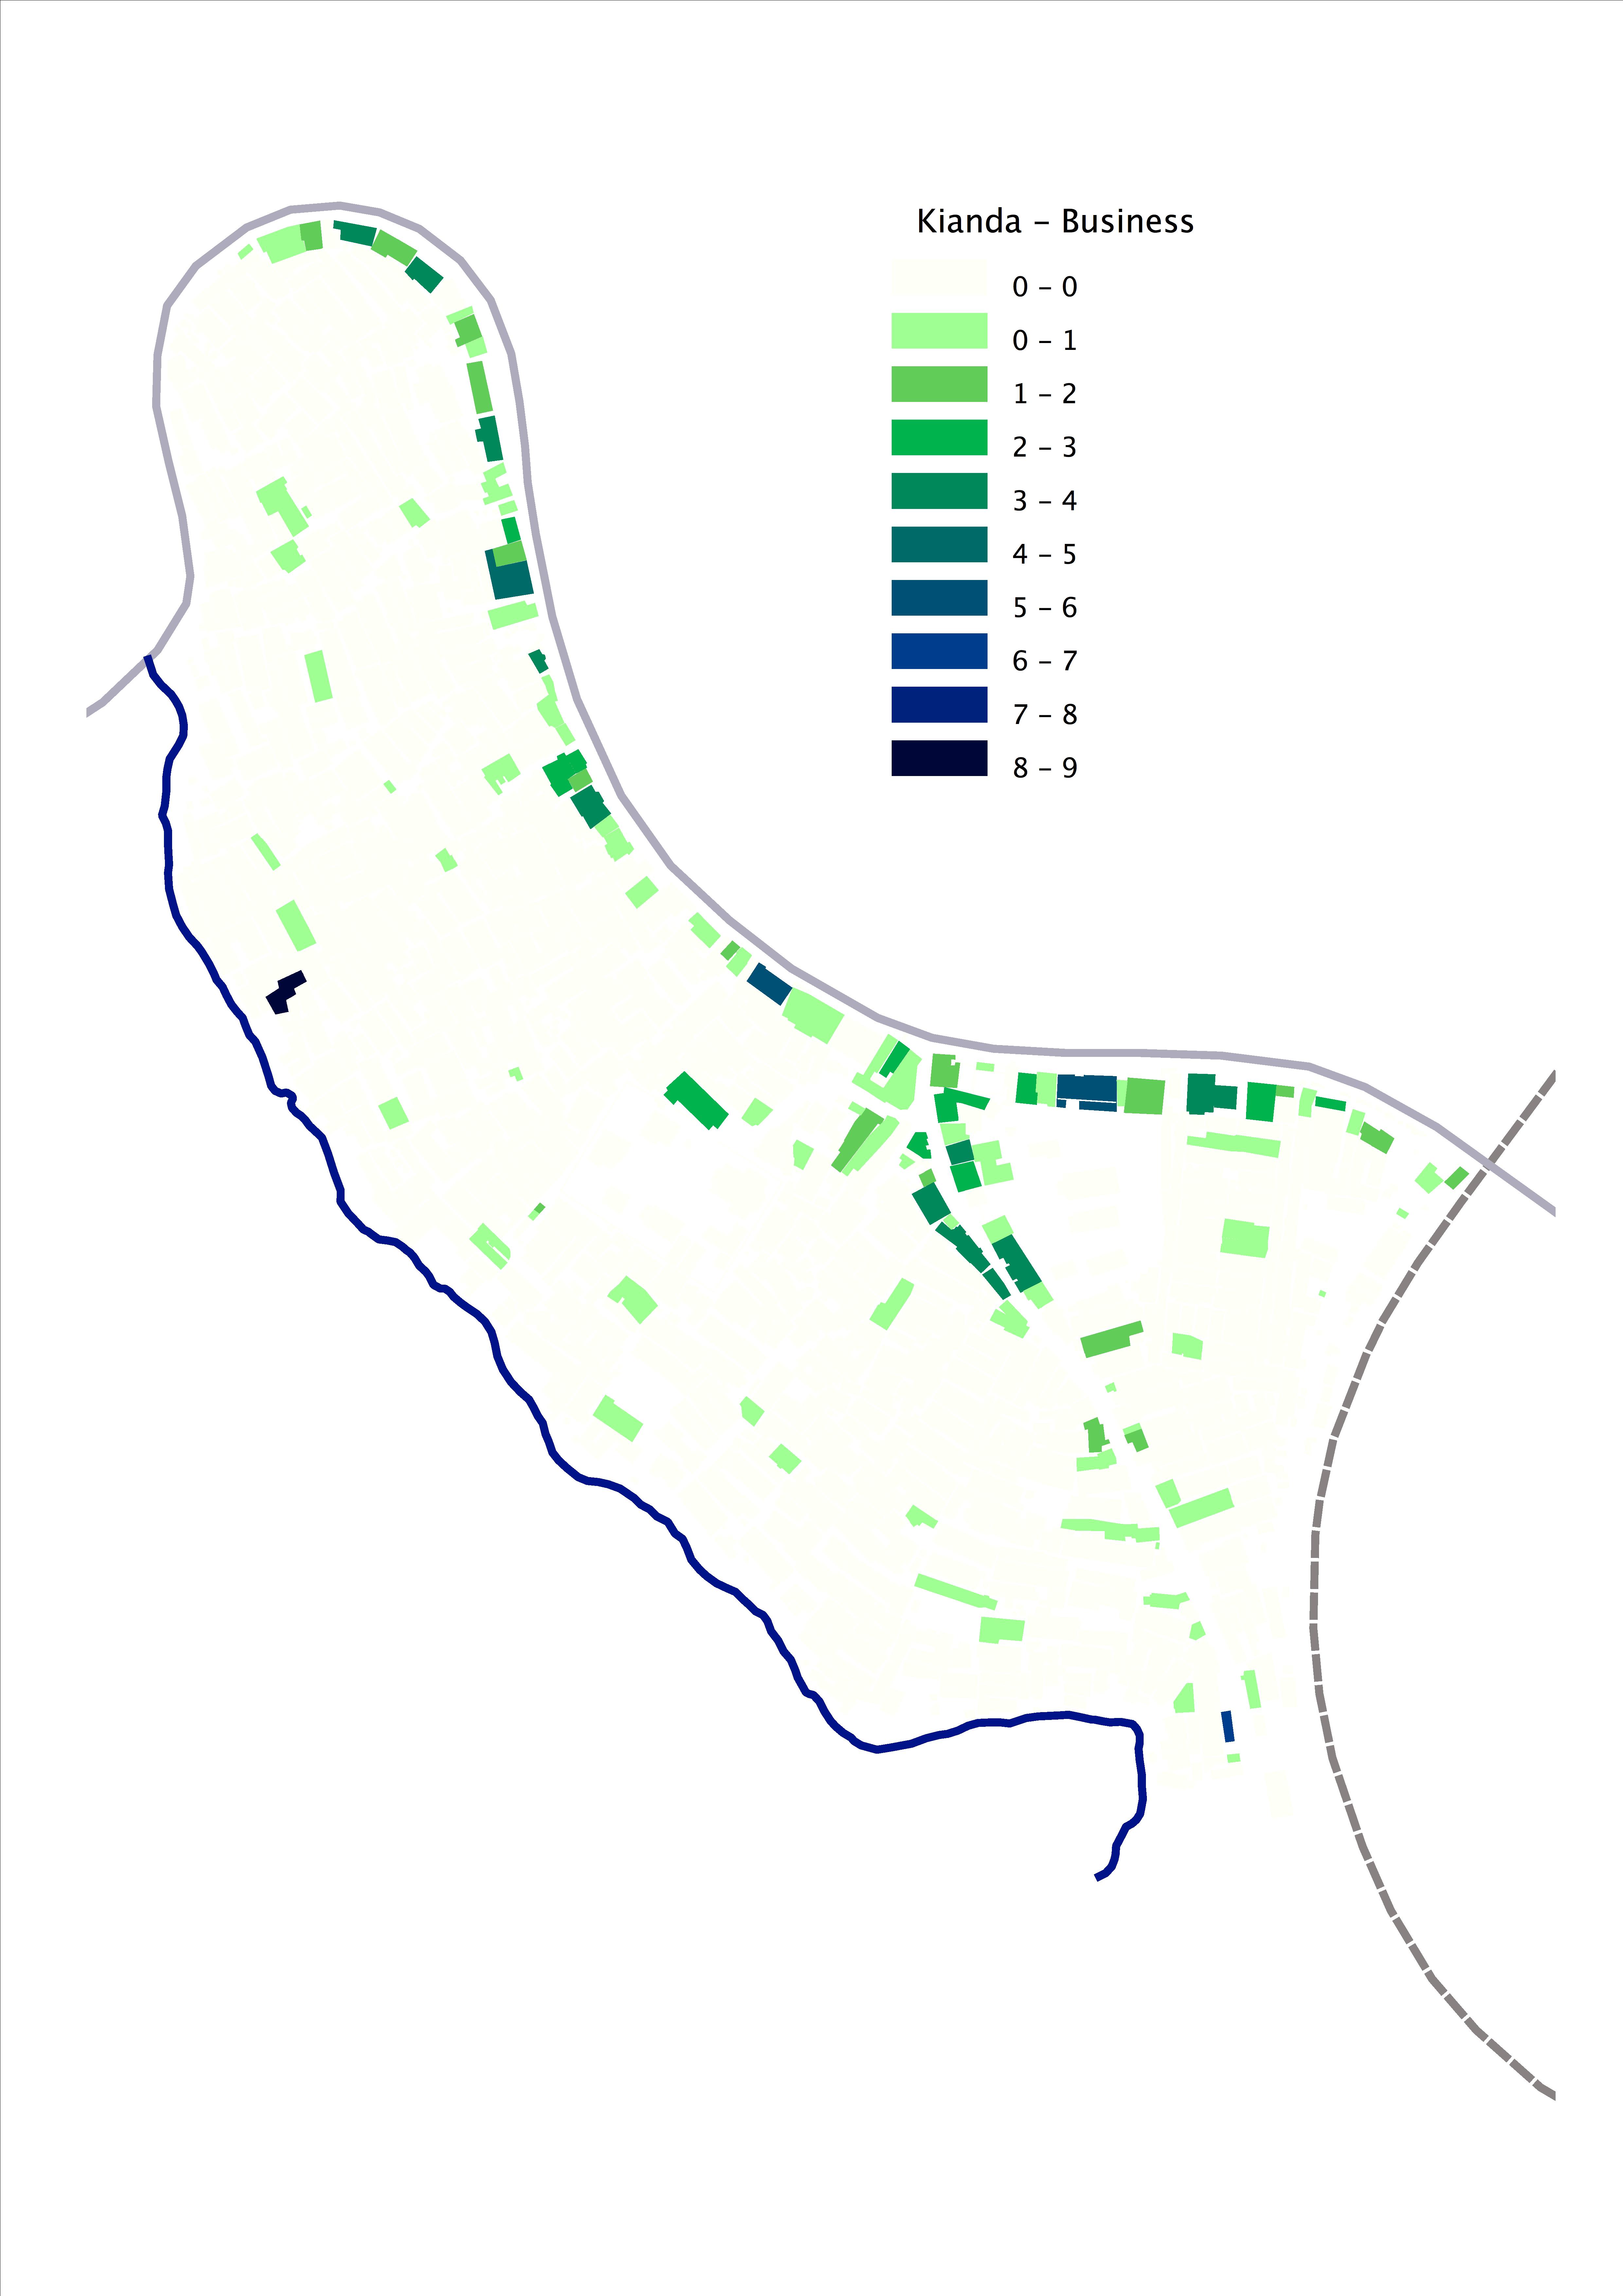
Business units: 231 (4.6%)
Service units: 30 (0.6%)
Empty units: 97 (1.94%)
Rooms (in household units): 4.996 (1.1 rooms in each household unit)
Economy
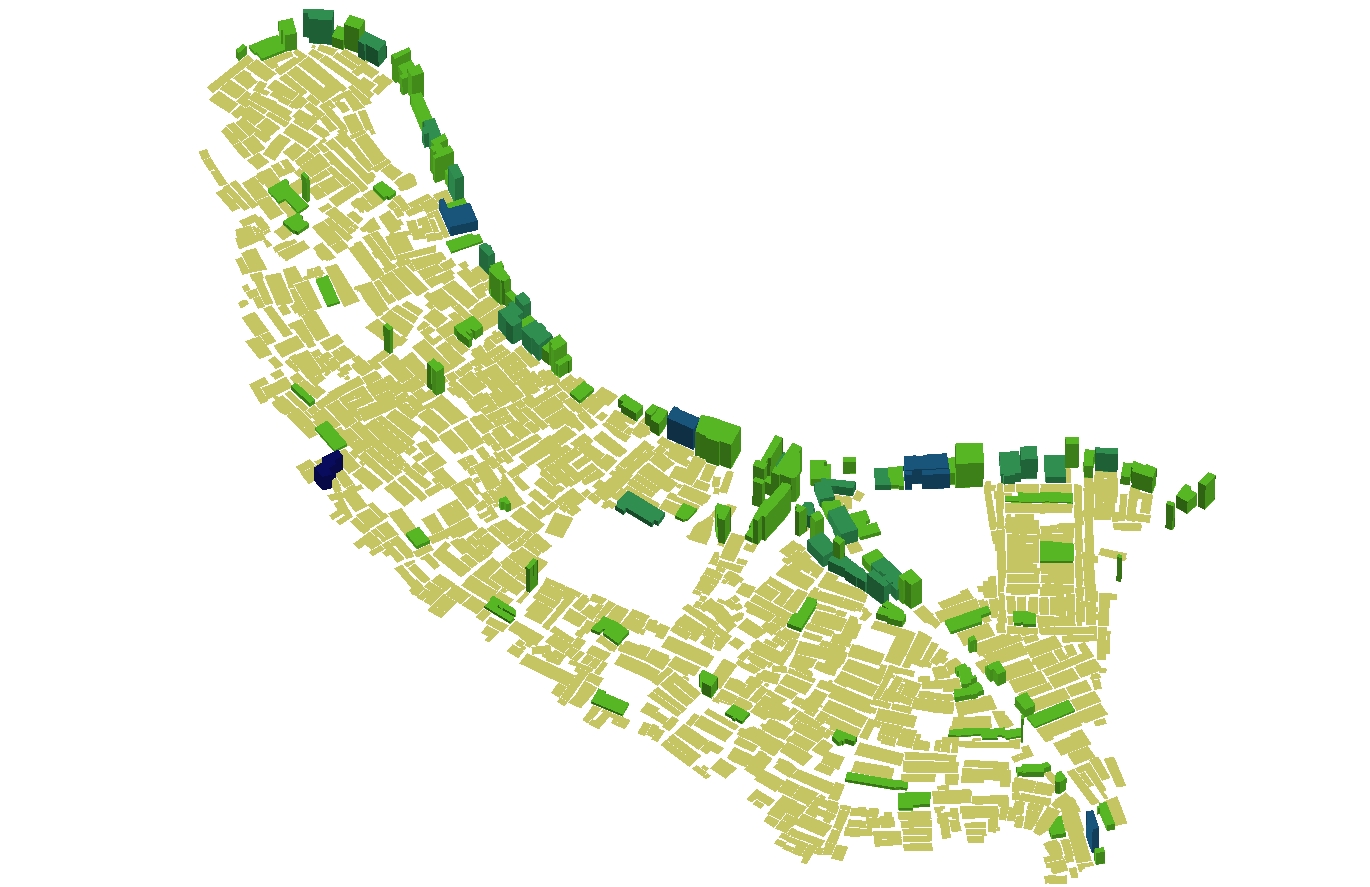
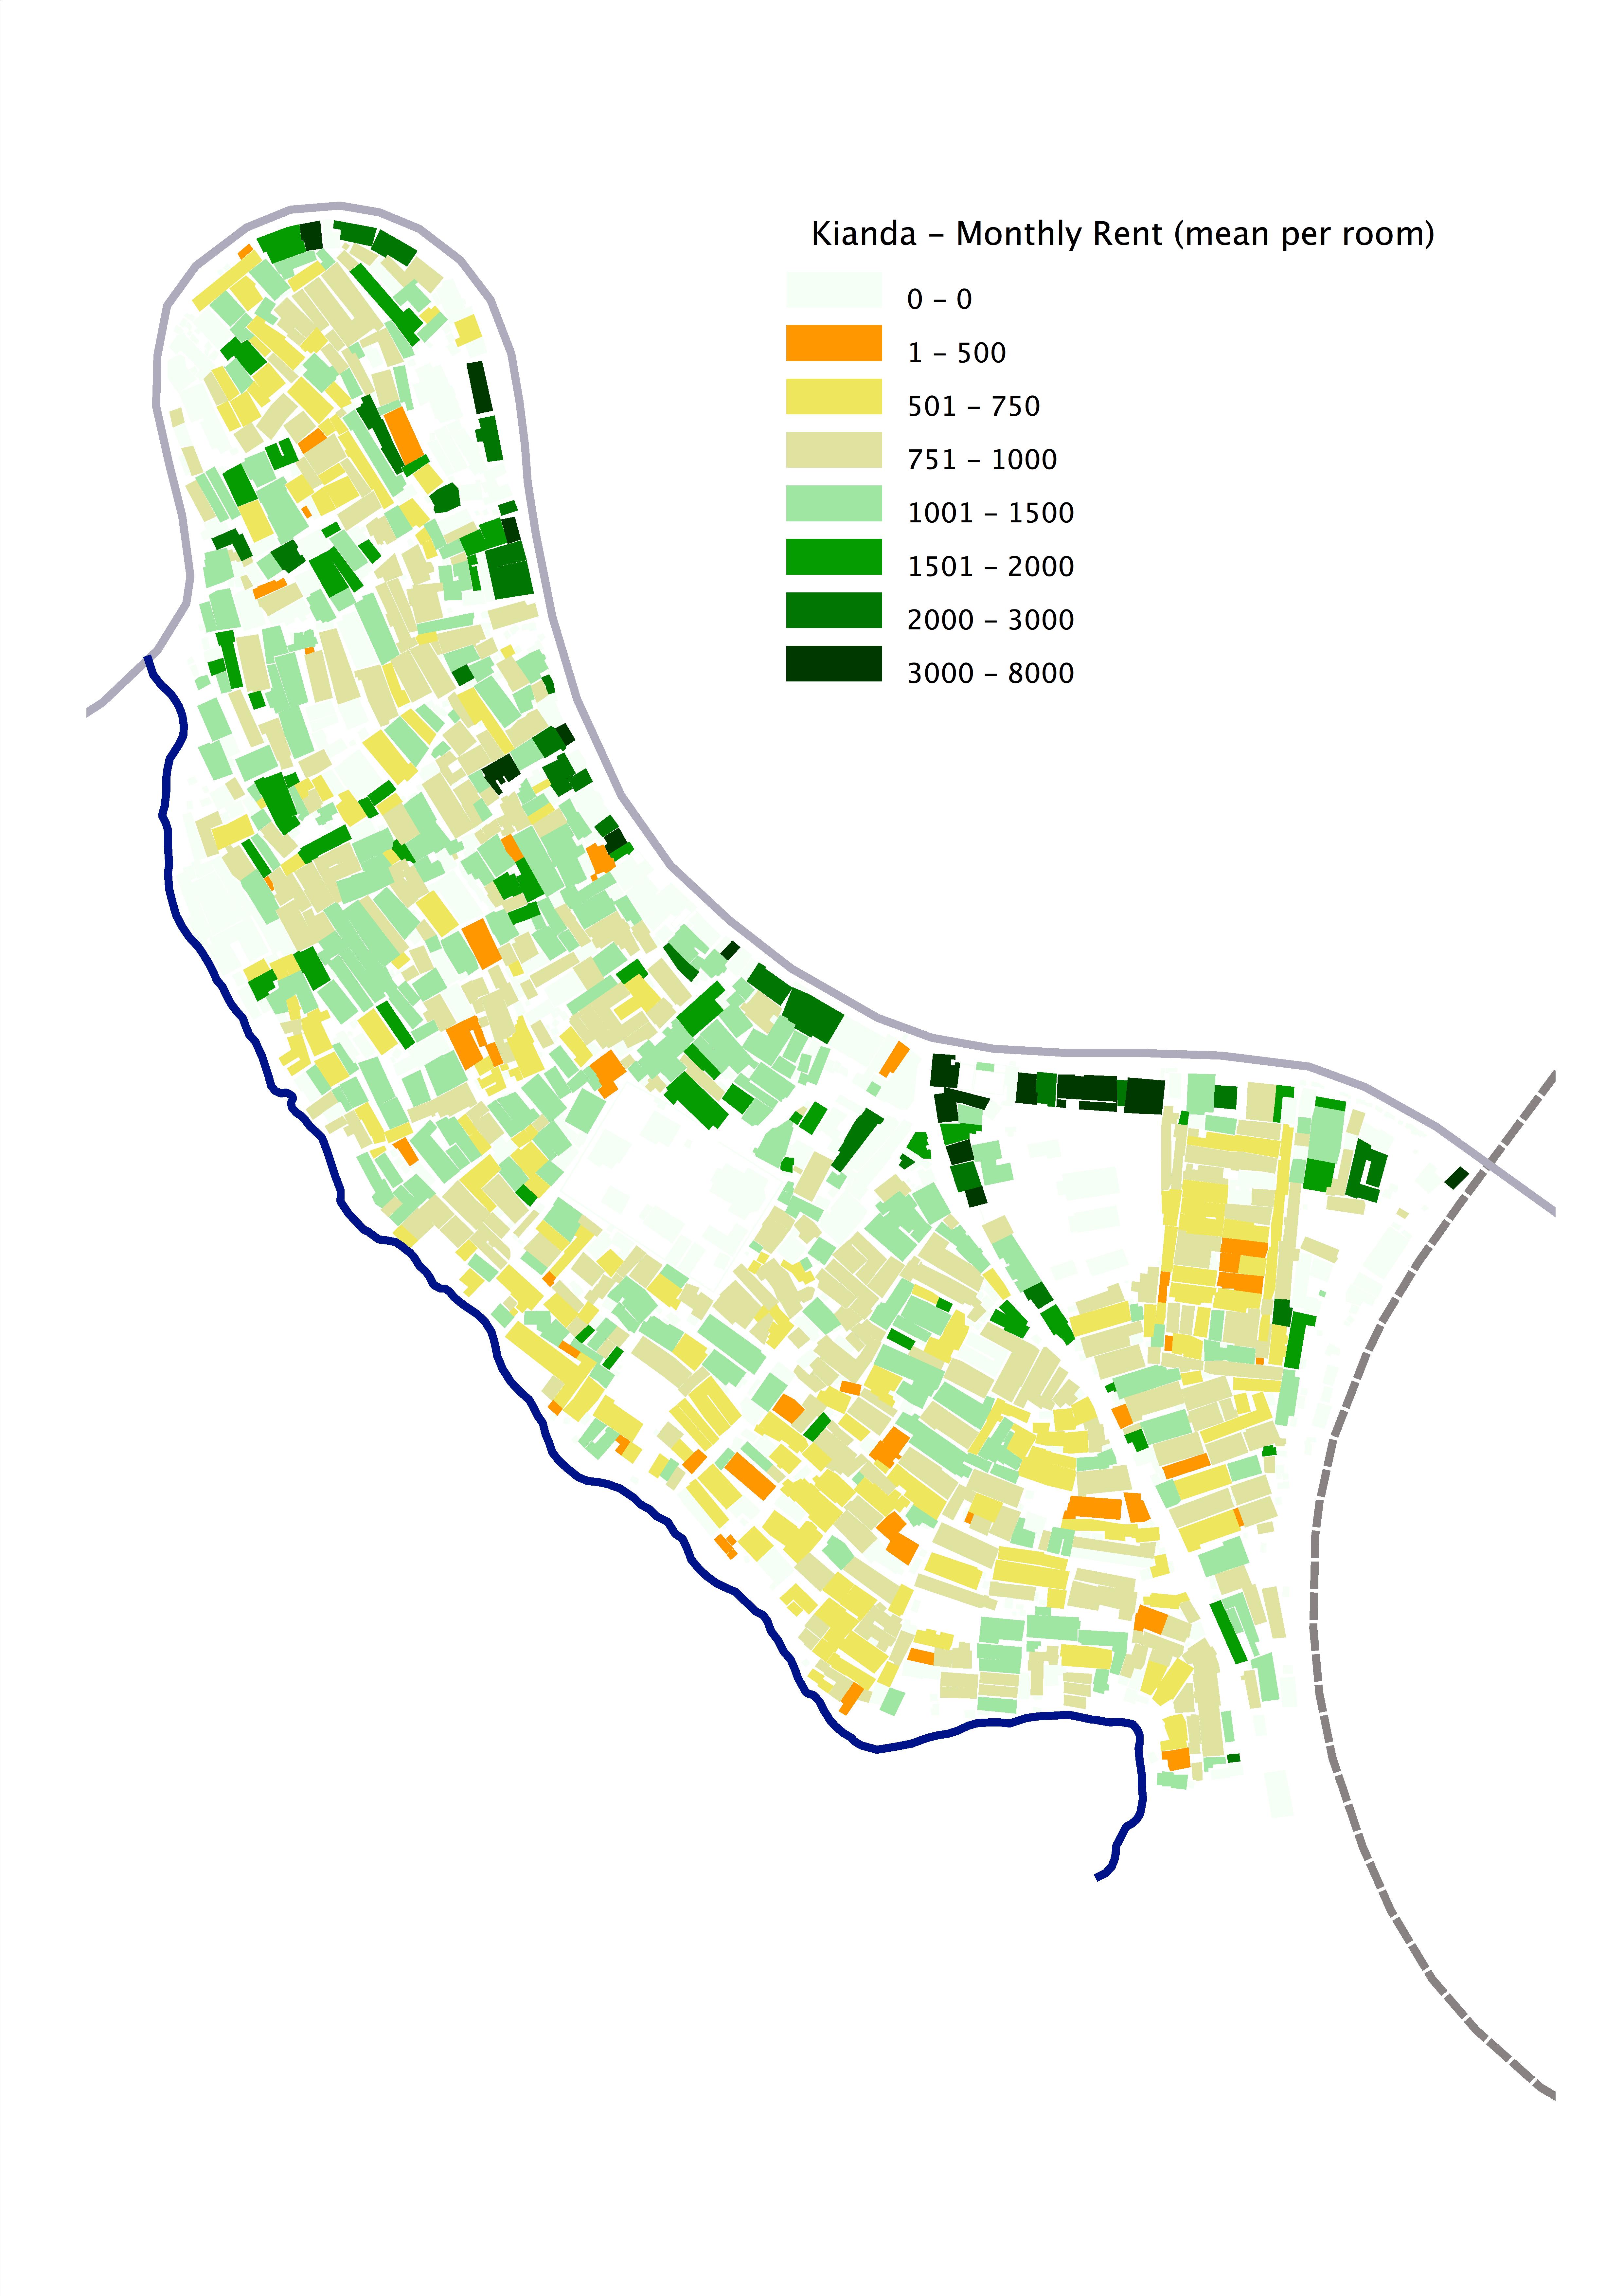
Average rent per room: 1,150 Ksh/month (11,5 US$/month, 8.5 €/month)
Estimated turnover:
in Kianda: 5,300.000 Ksh/month (53,000 US$/month, 39,500 €/month)
63,600,000 Ksh/year (636,000 US$/year, 474,000 €/year)
in Kibera: 86,000,000 Ksh/month (870,000 US$/month, 640,000 €/month)
1,032,000,000 Ksh/year (10,440,000 $/year, 7,680,000 €/year)
Units owned by residents: 210 (4.1% of all units)
Structures with at least one unit owned by a resident: 170
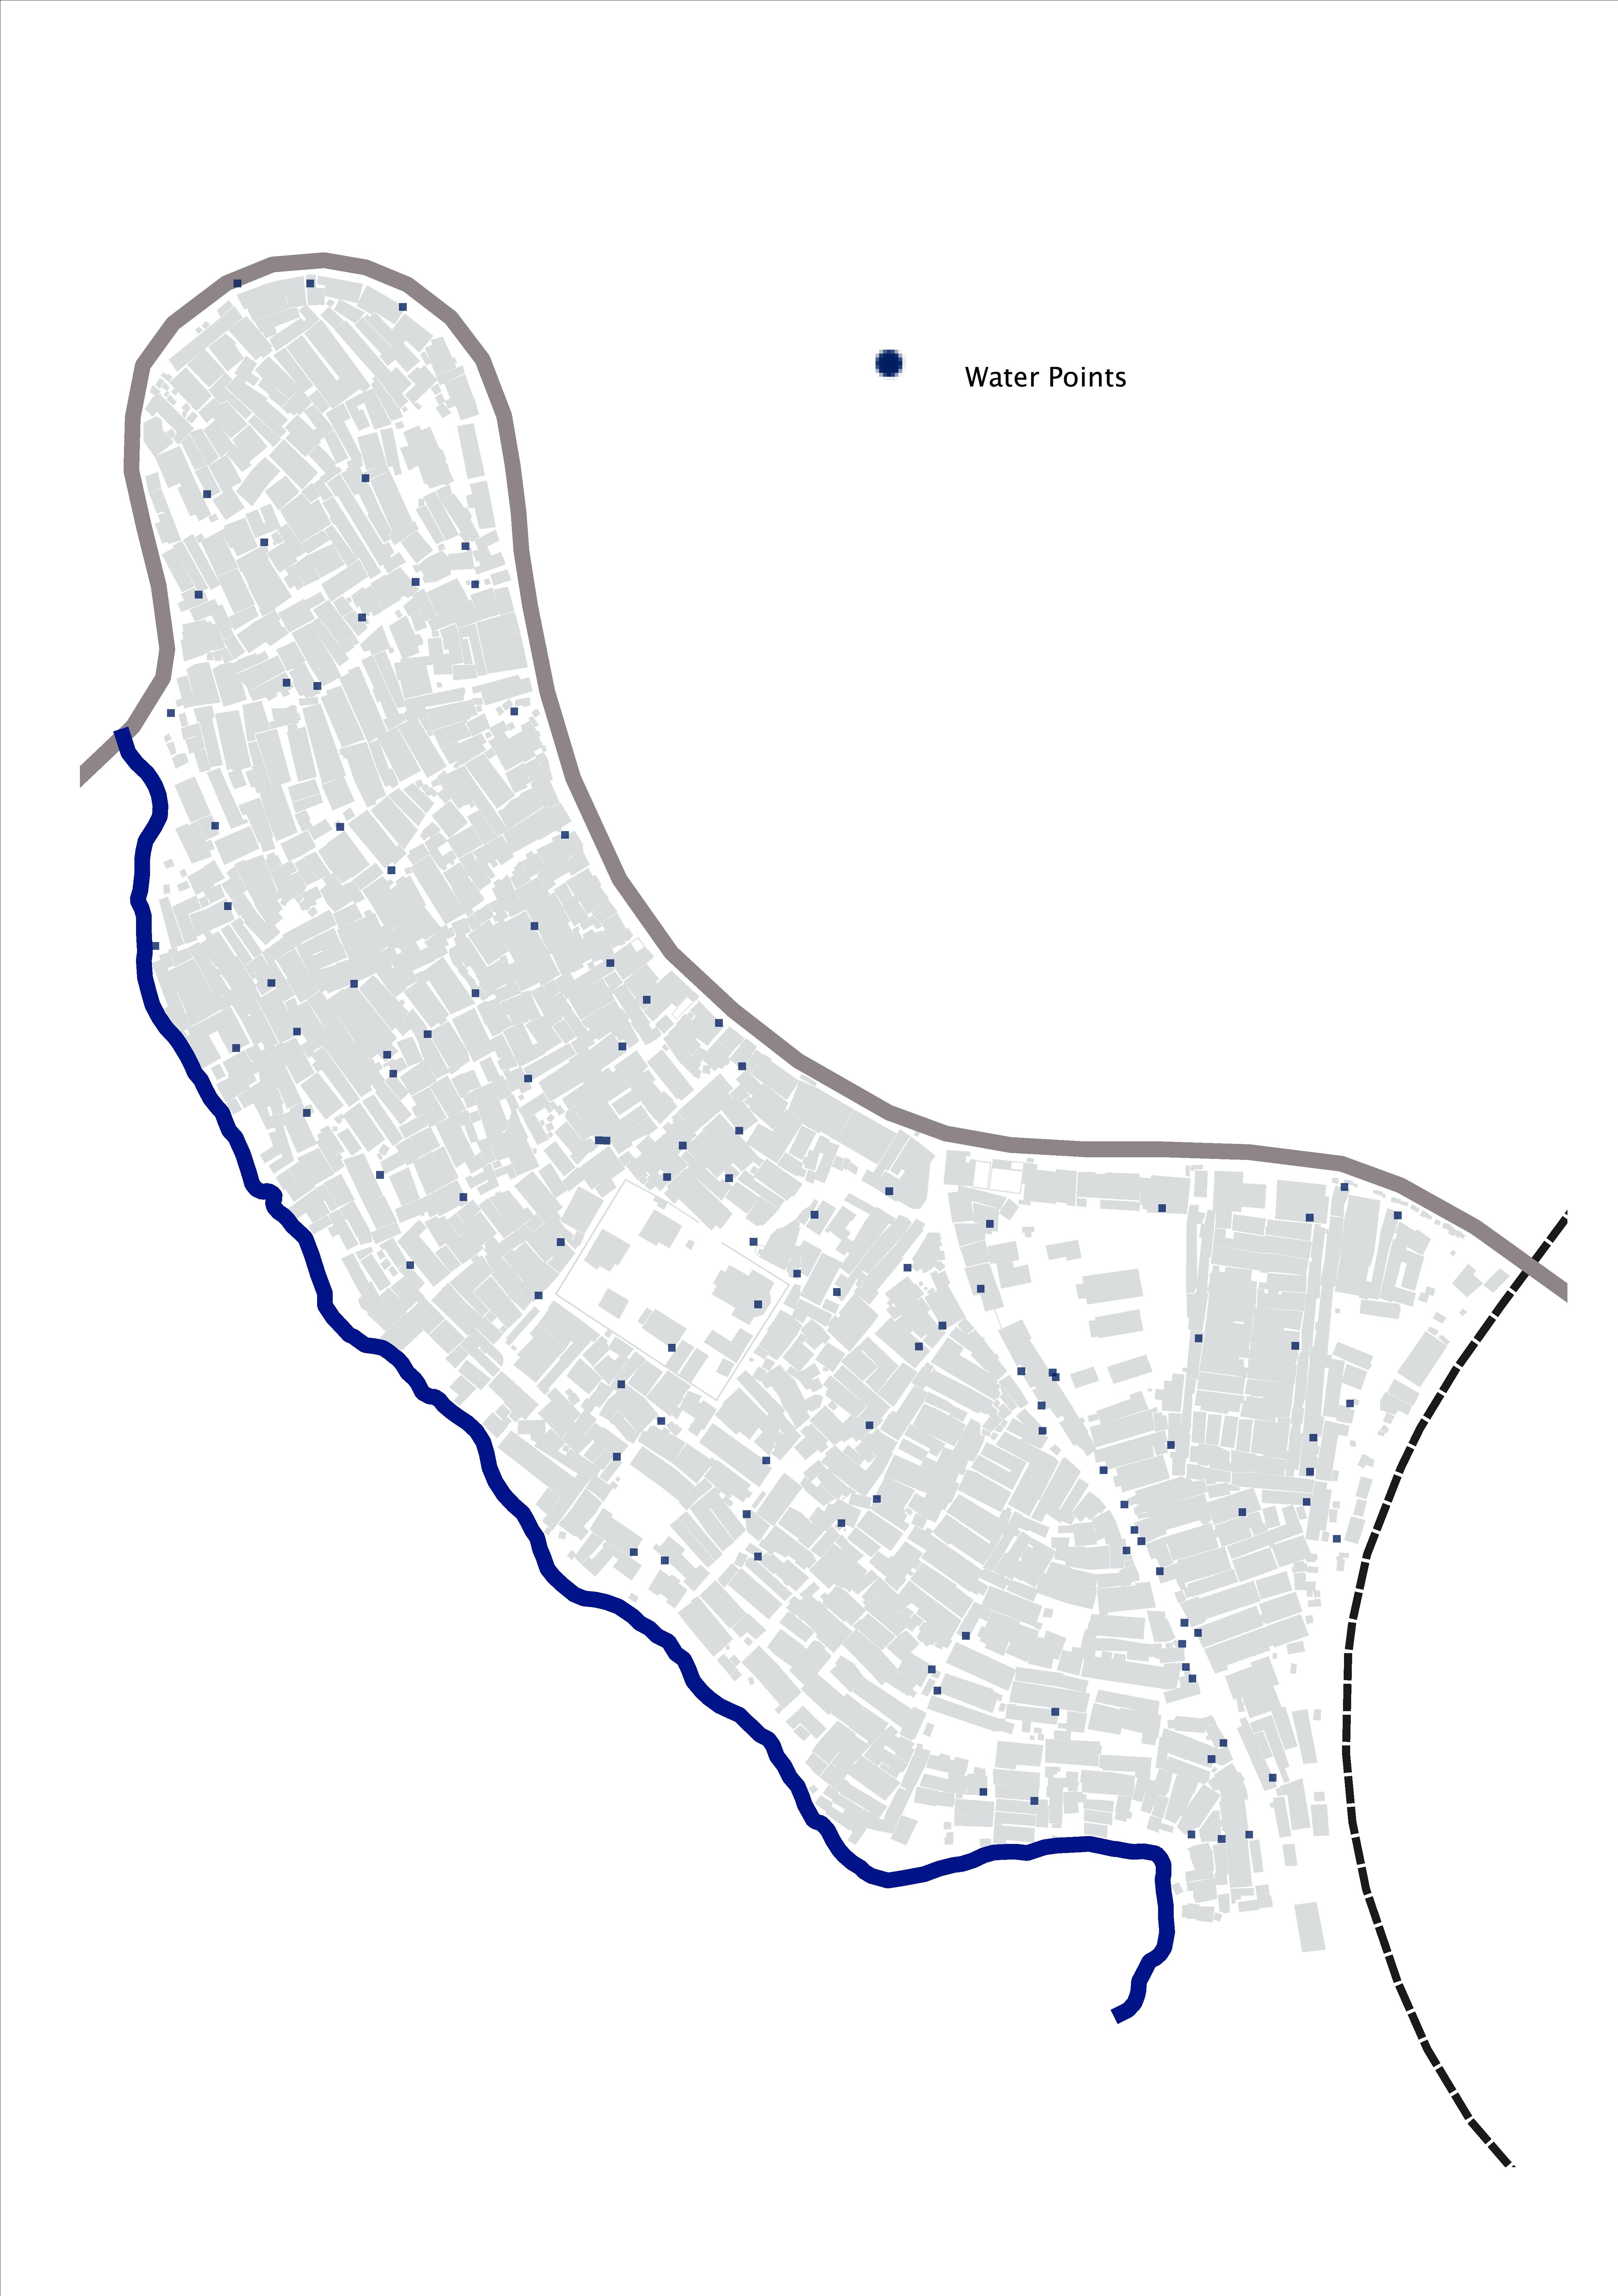
Infrastructures
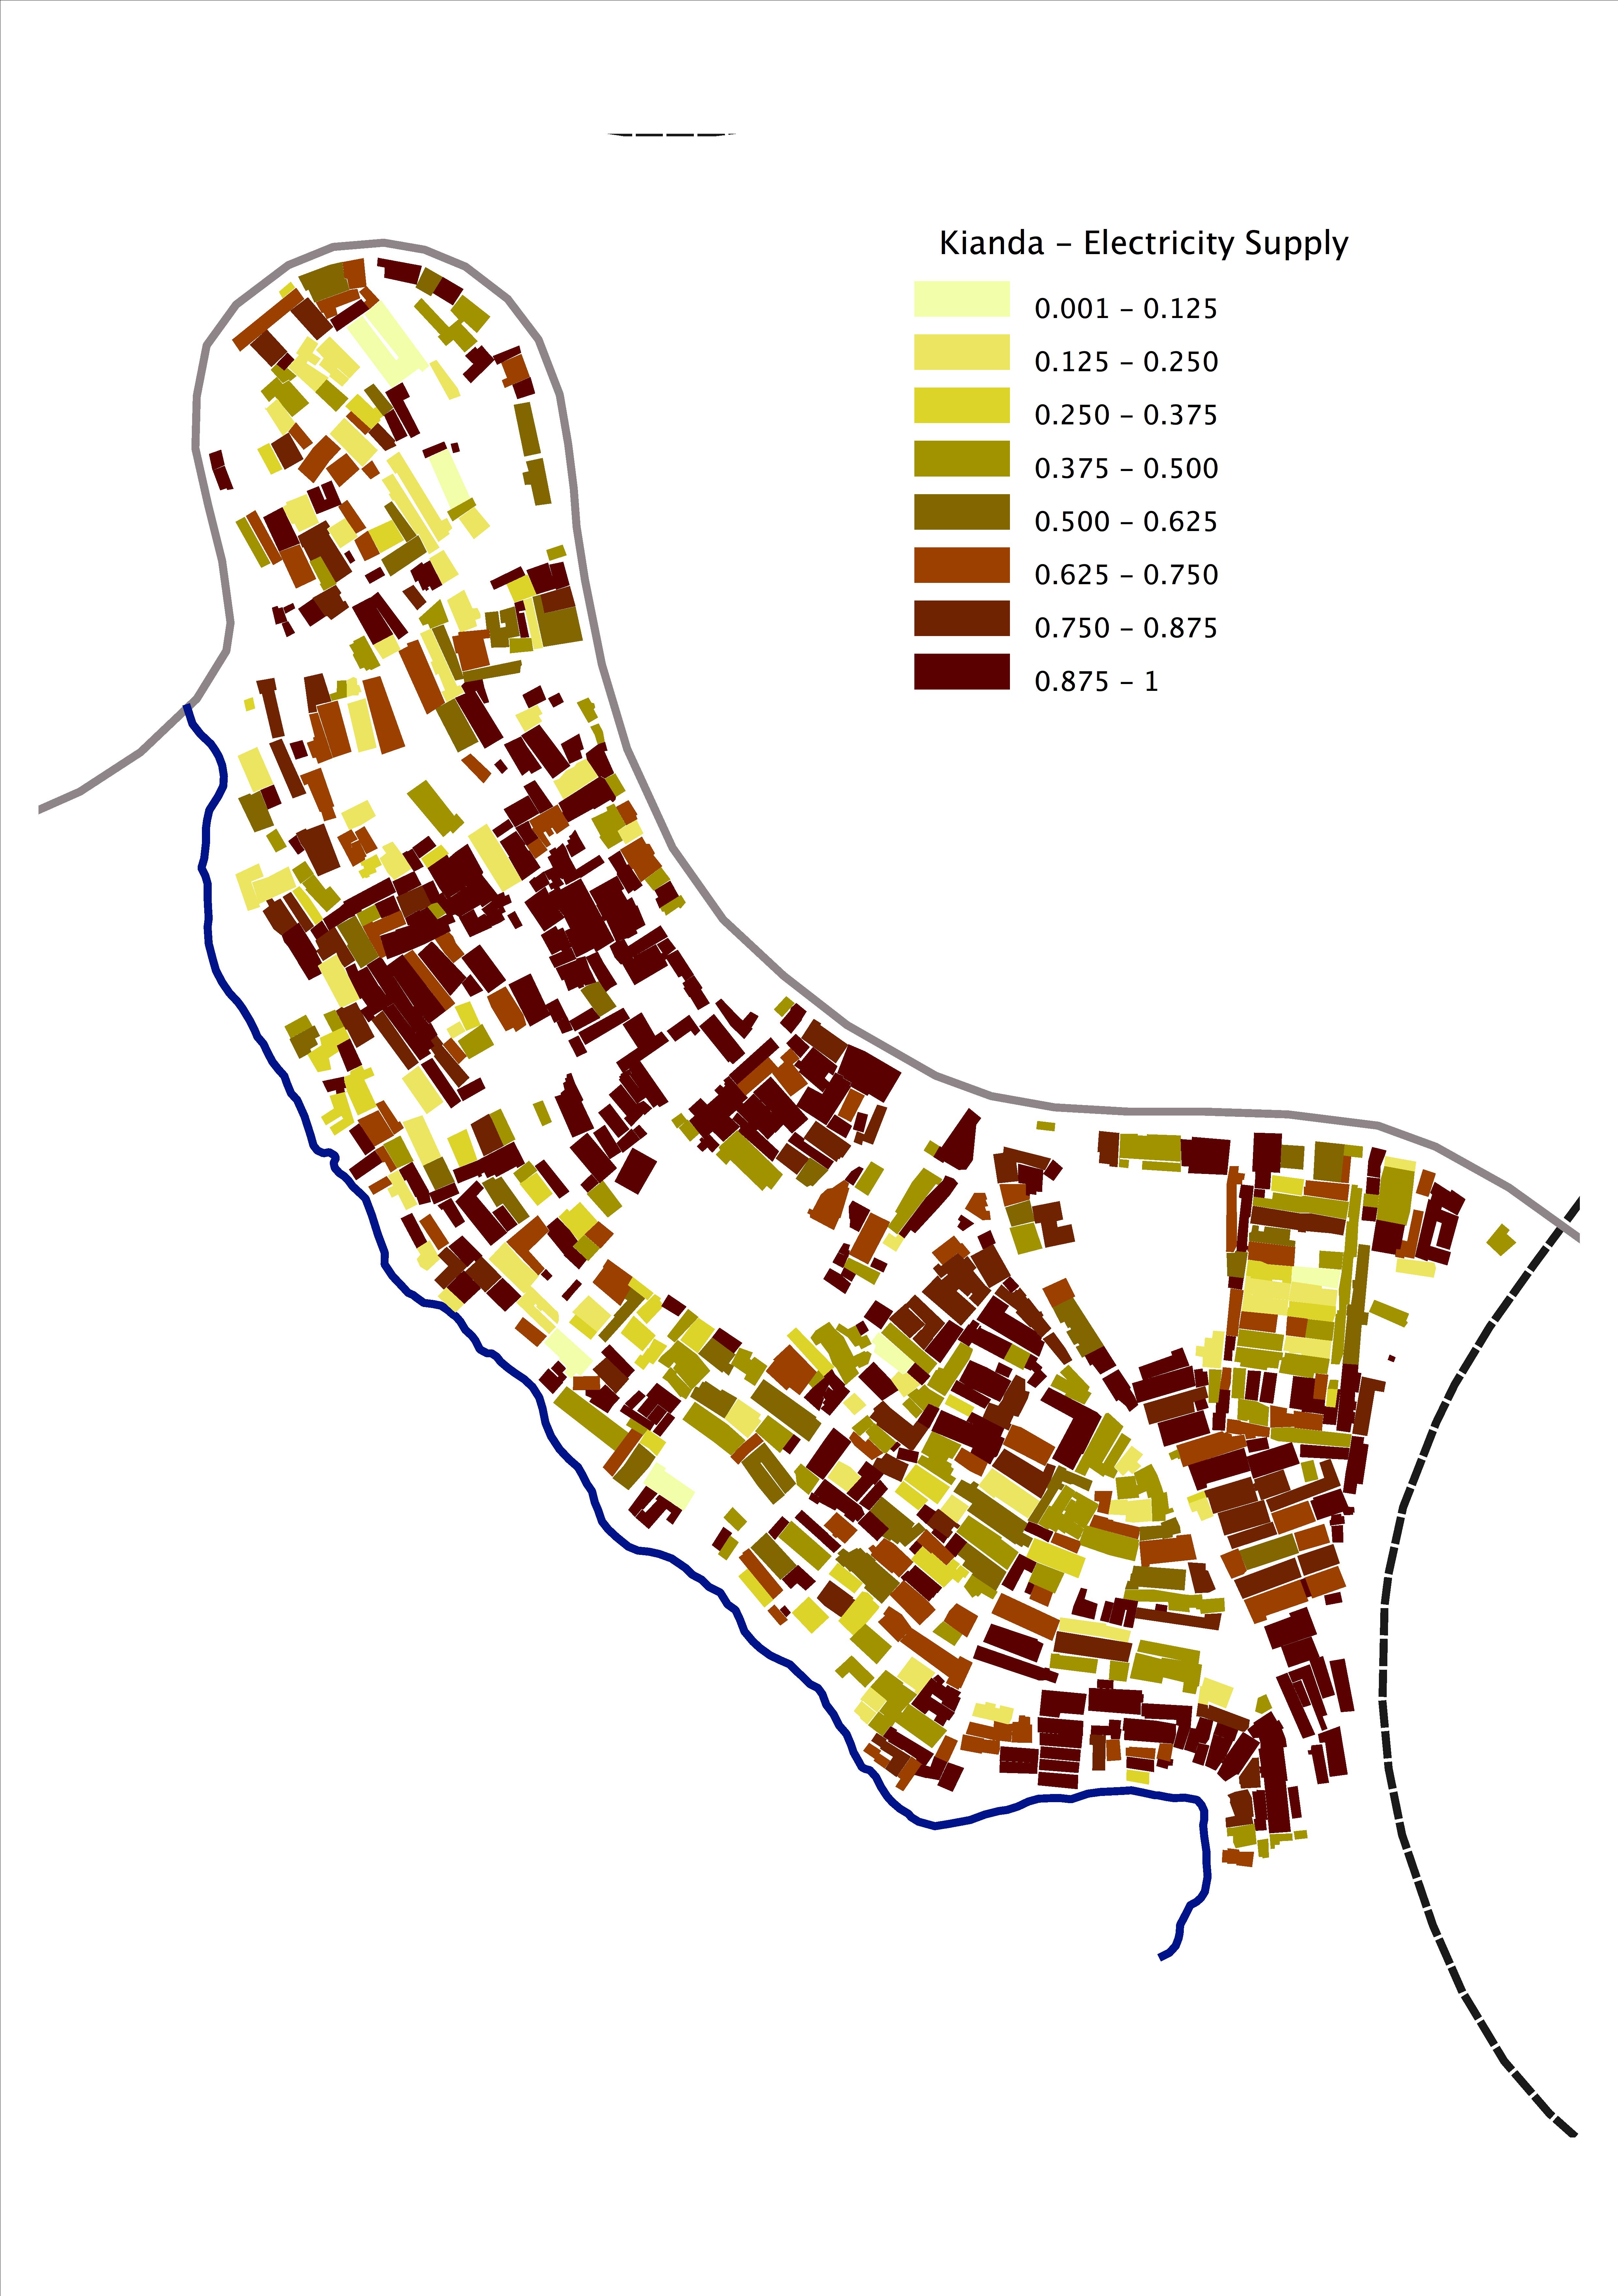
Units supplied with electricity: 2,880 (58%)
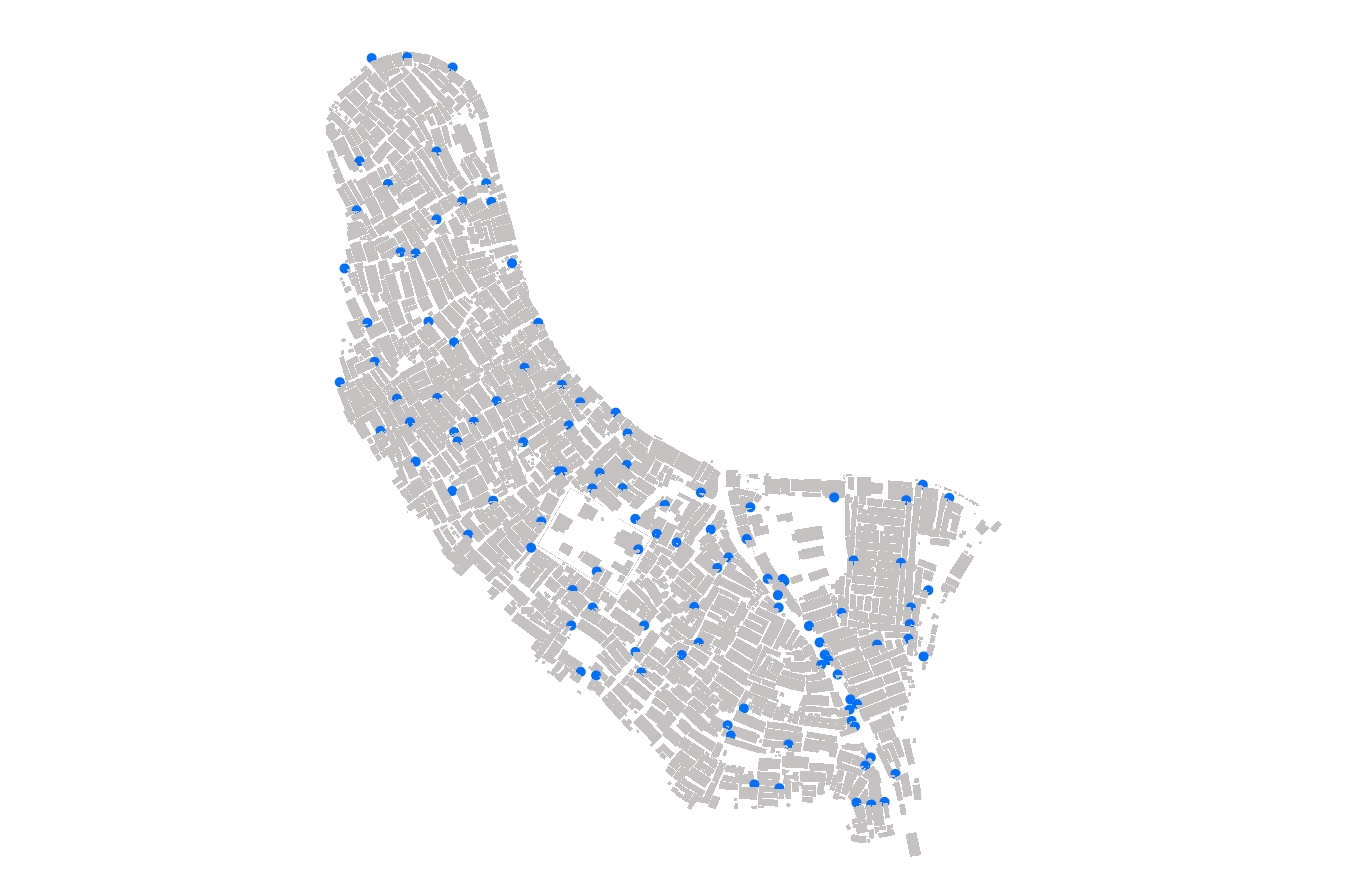
Water points: 115 (1 wp every 132 people)
|
Kianda Maps
Download maps in pdf, jpg, kmz extensions.Terrain 2D, 3D, GoogleEarth
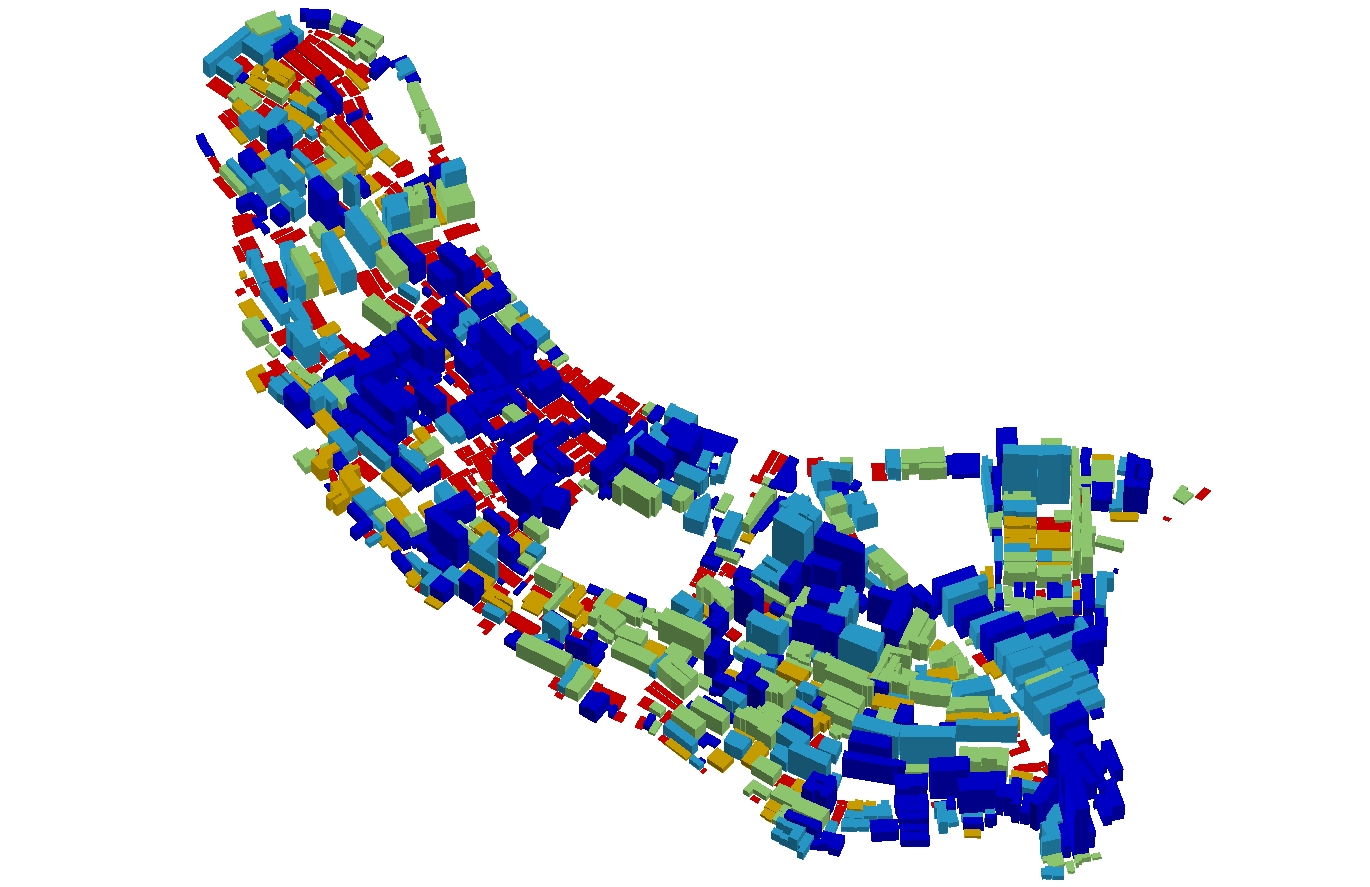
Structures 2D, 3D, GoogleEarth
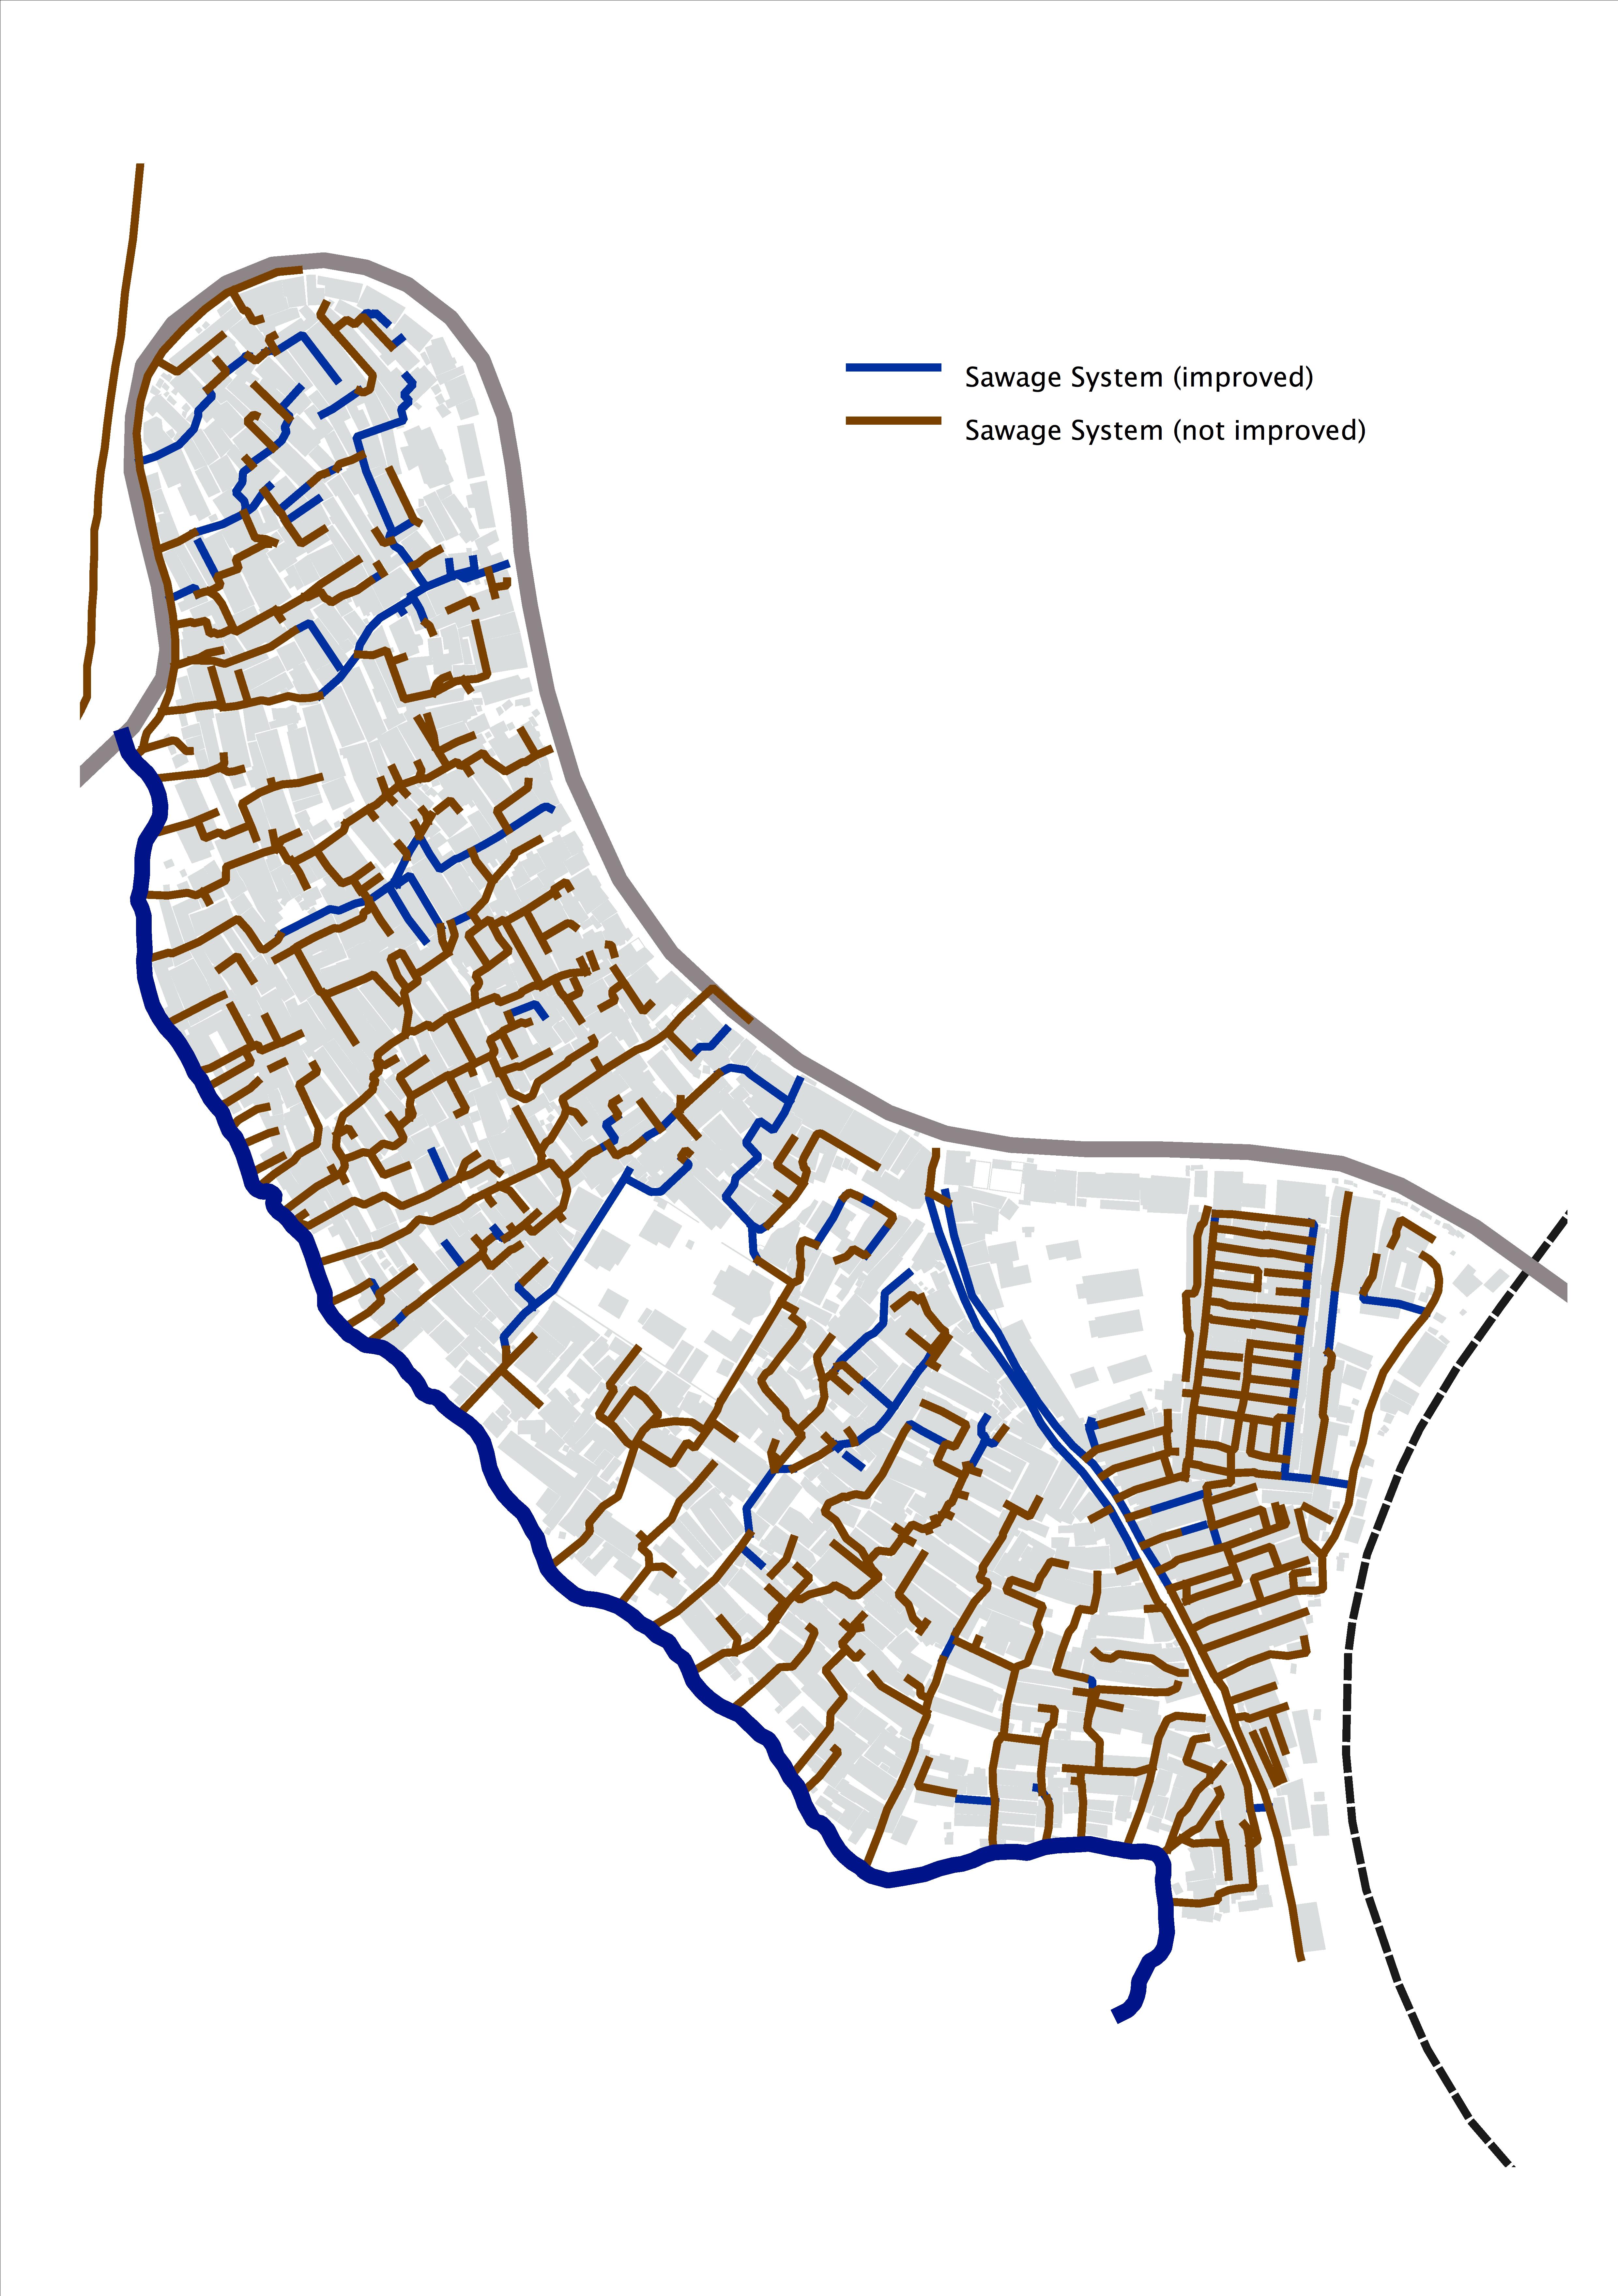
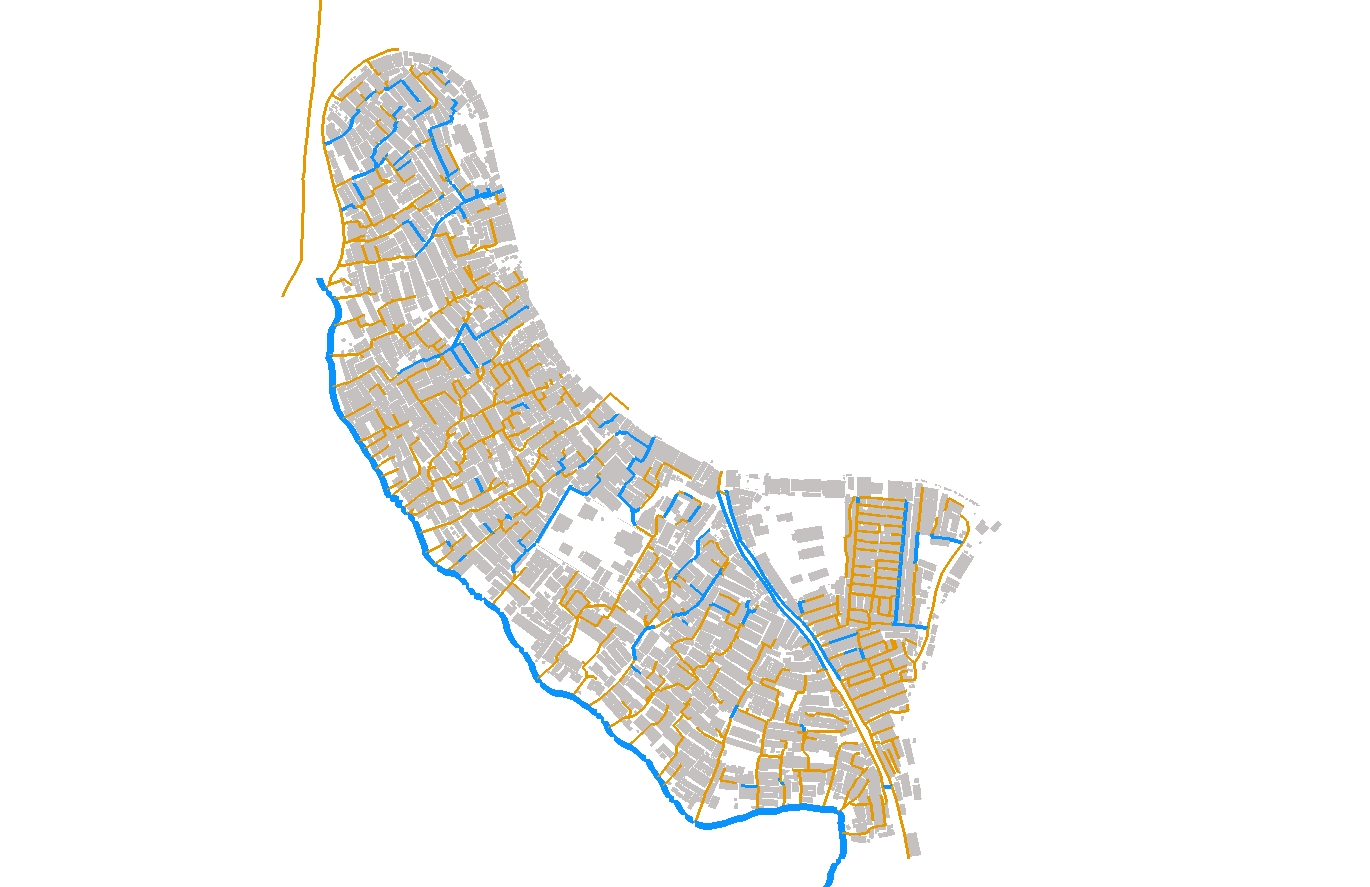
Sewage system 2D, 3D, GoogleEarth
Water points 2D, 3D, GoogleEarth
Electricity supply 2D, 3D
Public toilets & lavatories 2D, 3D
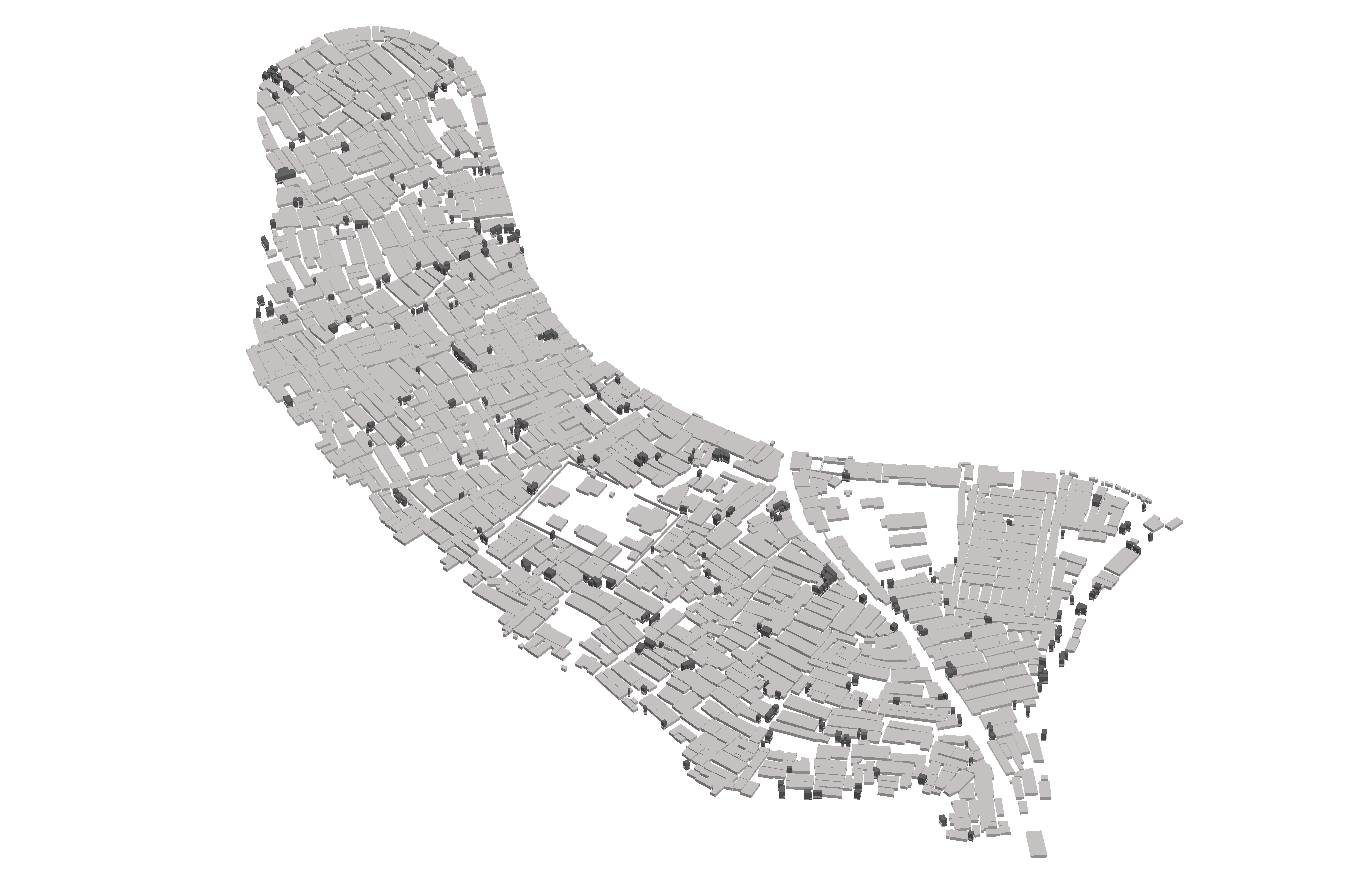
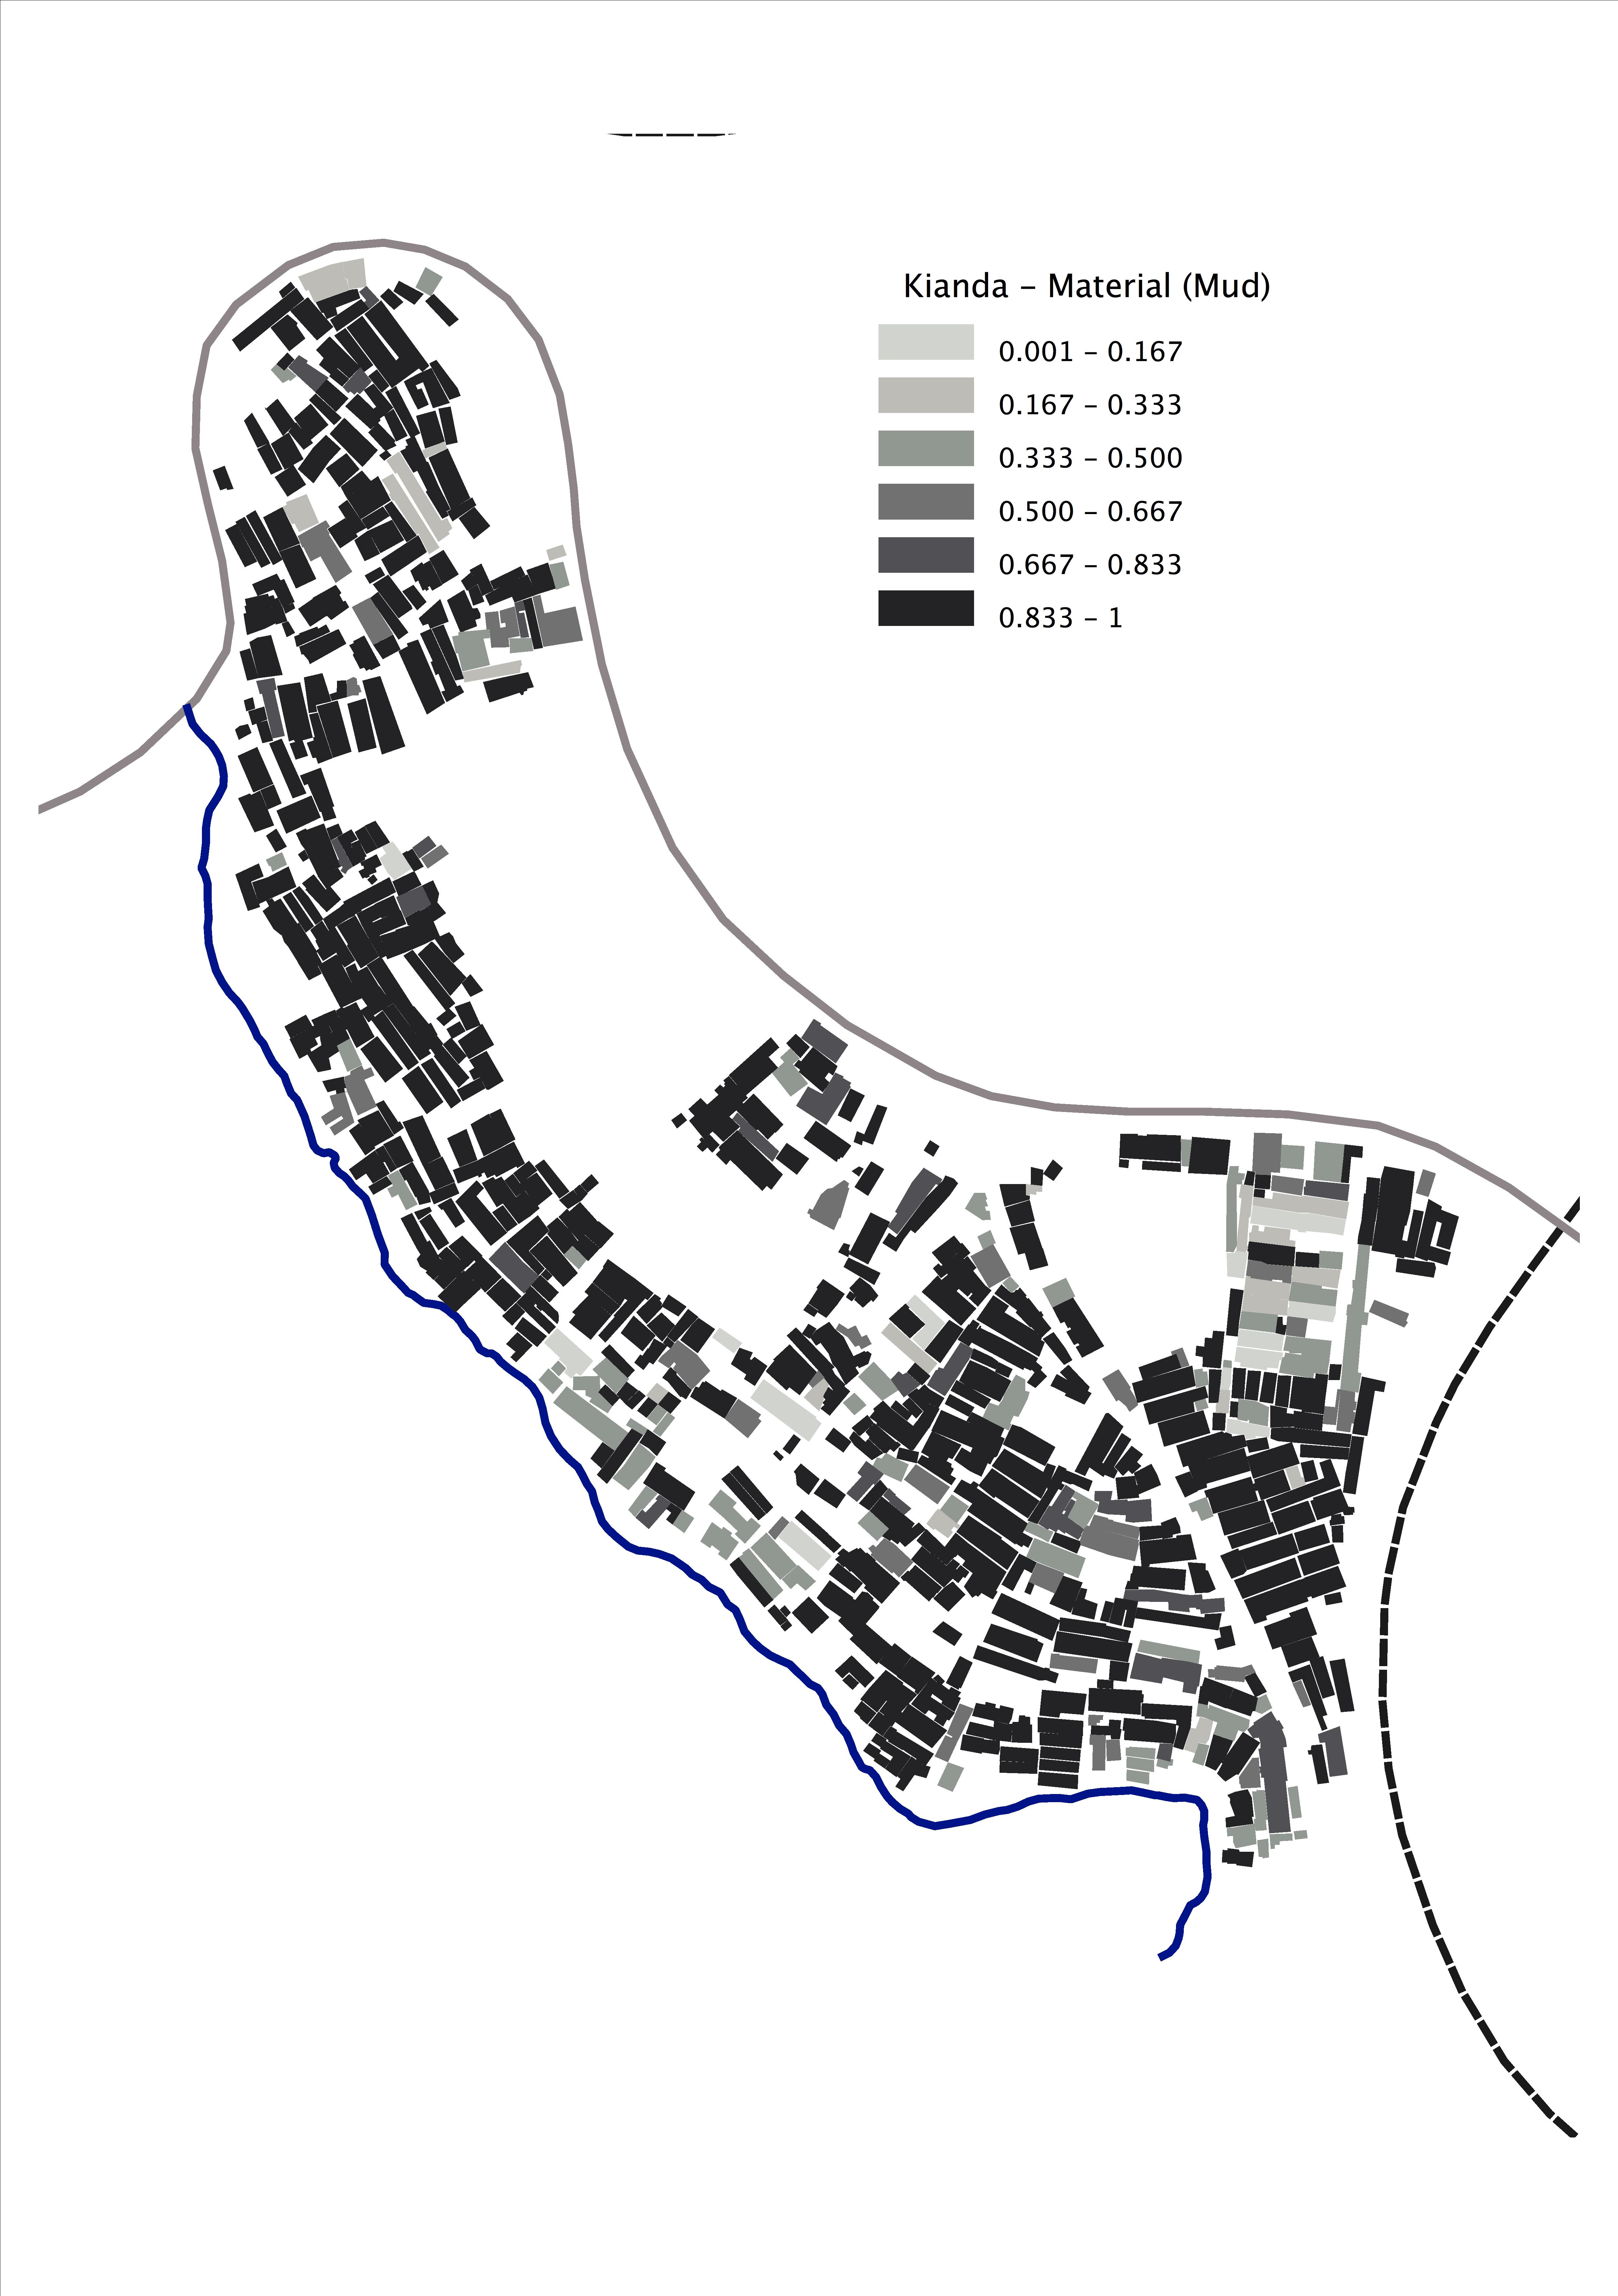
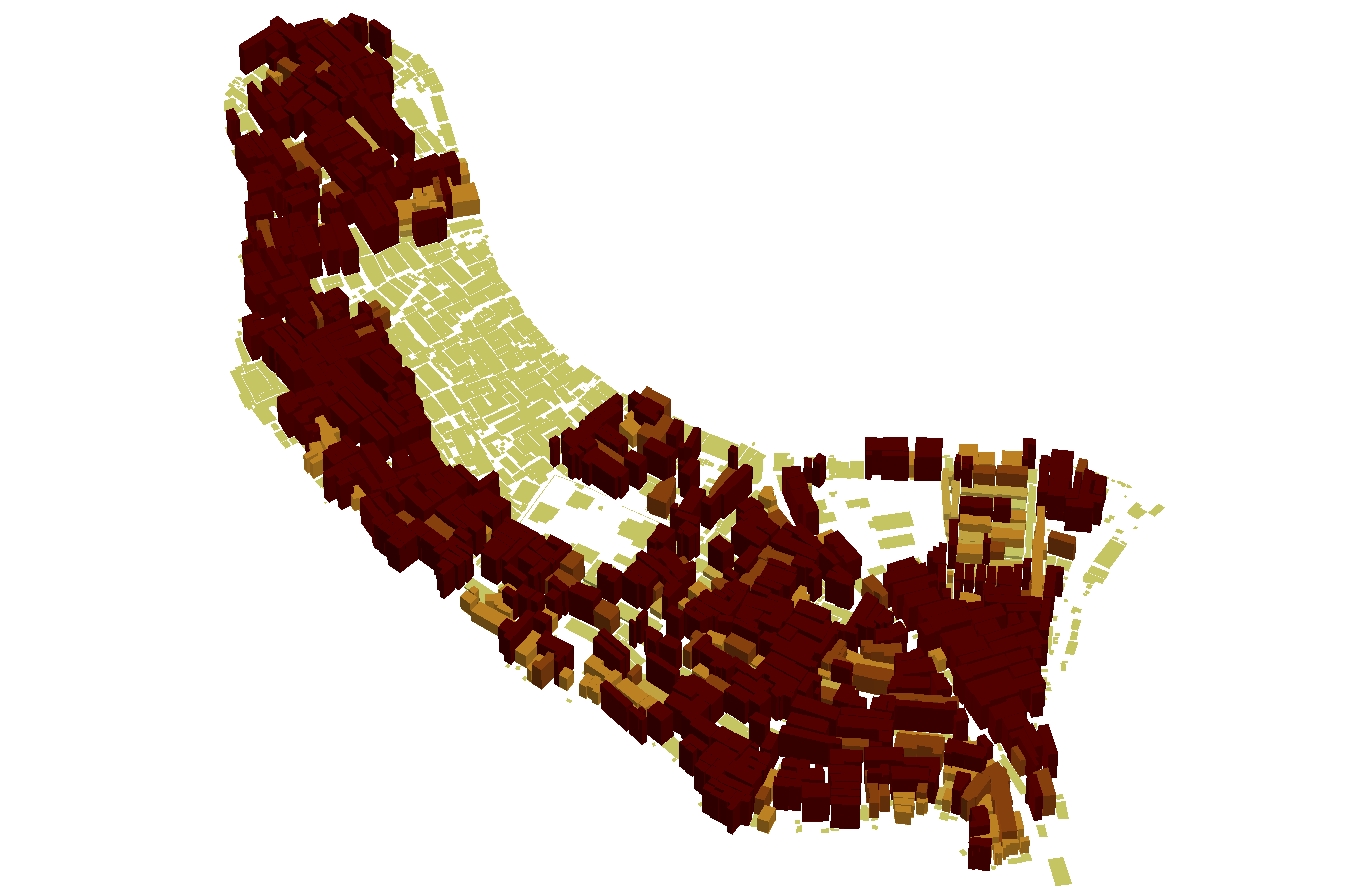
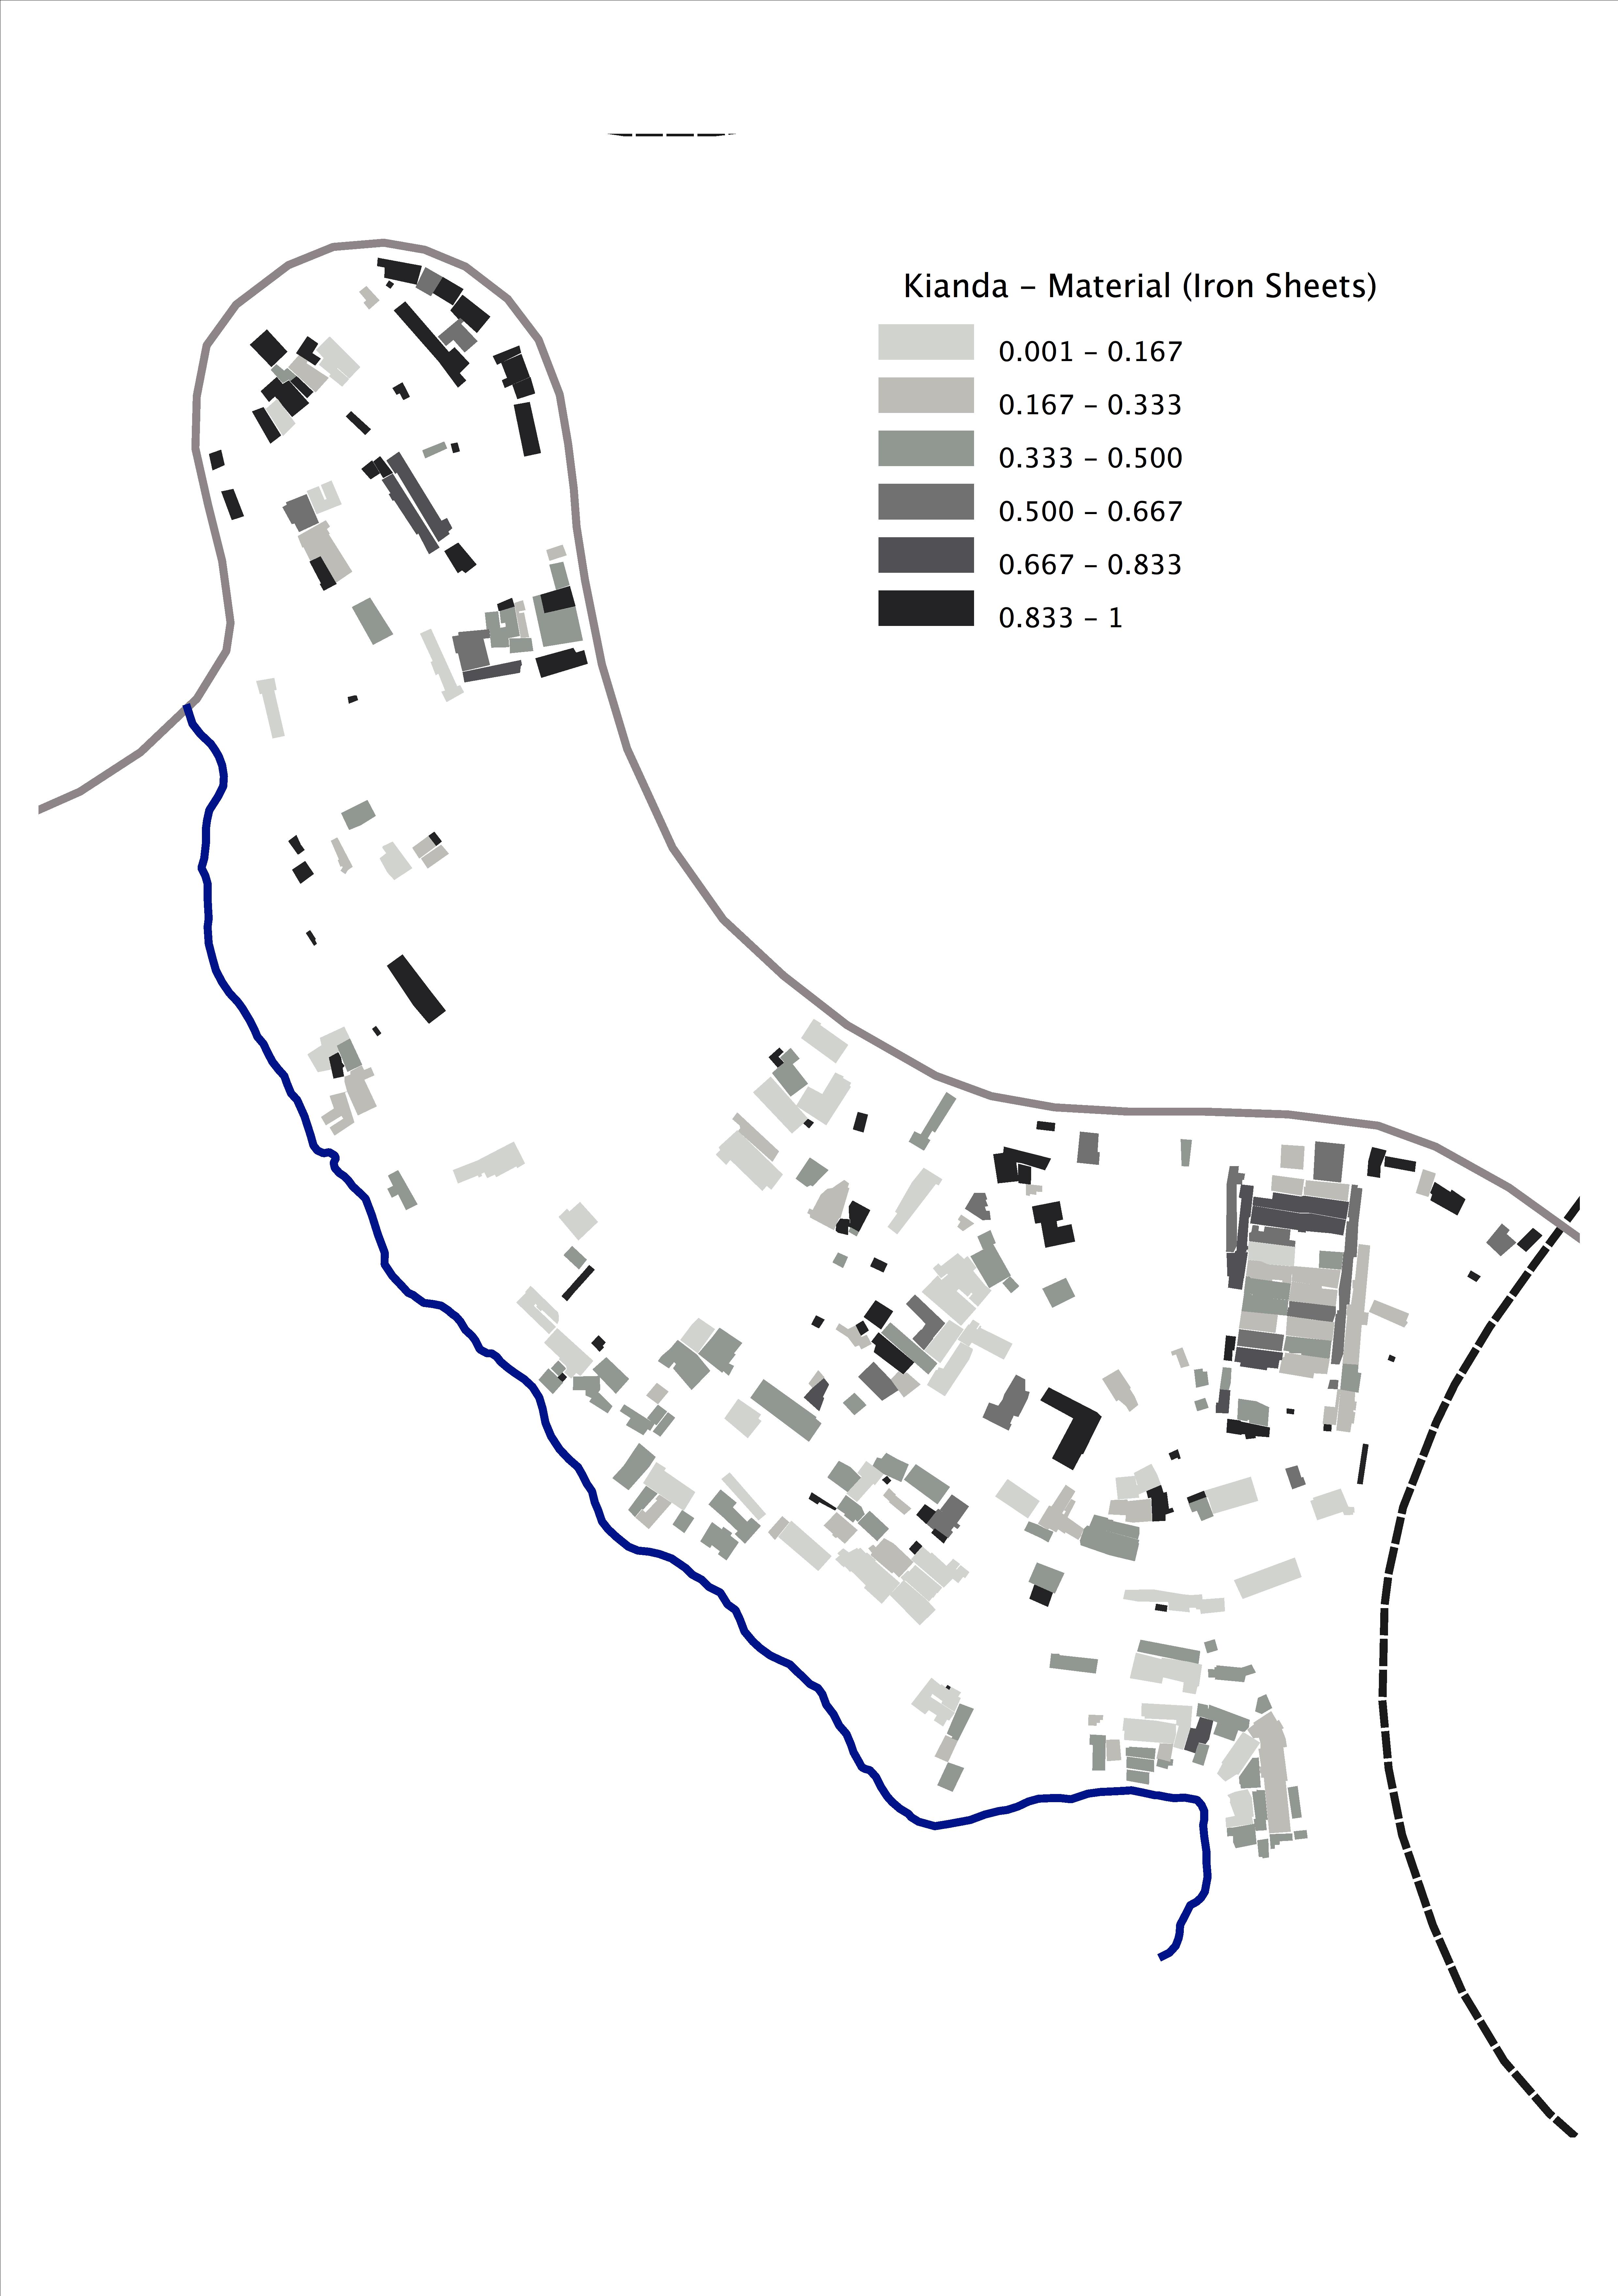
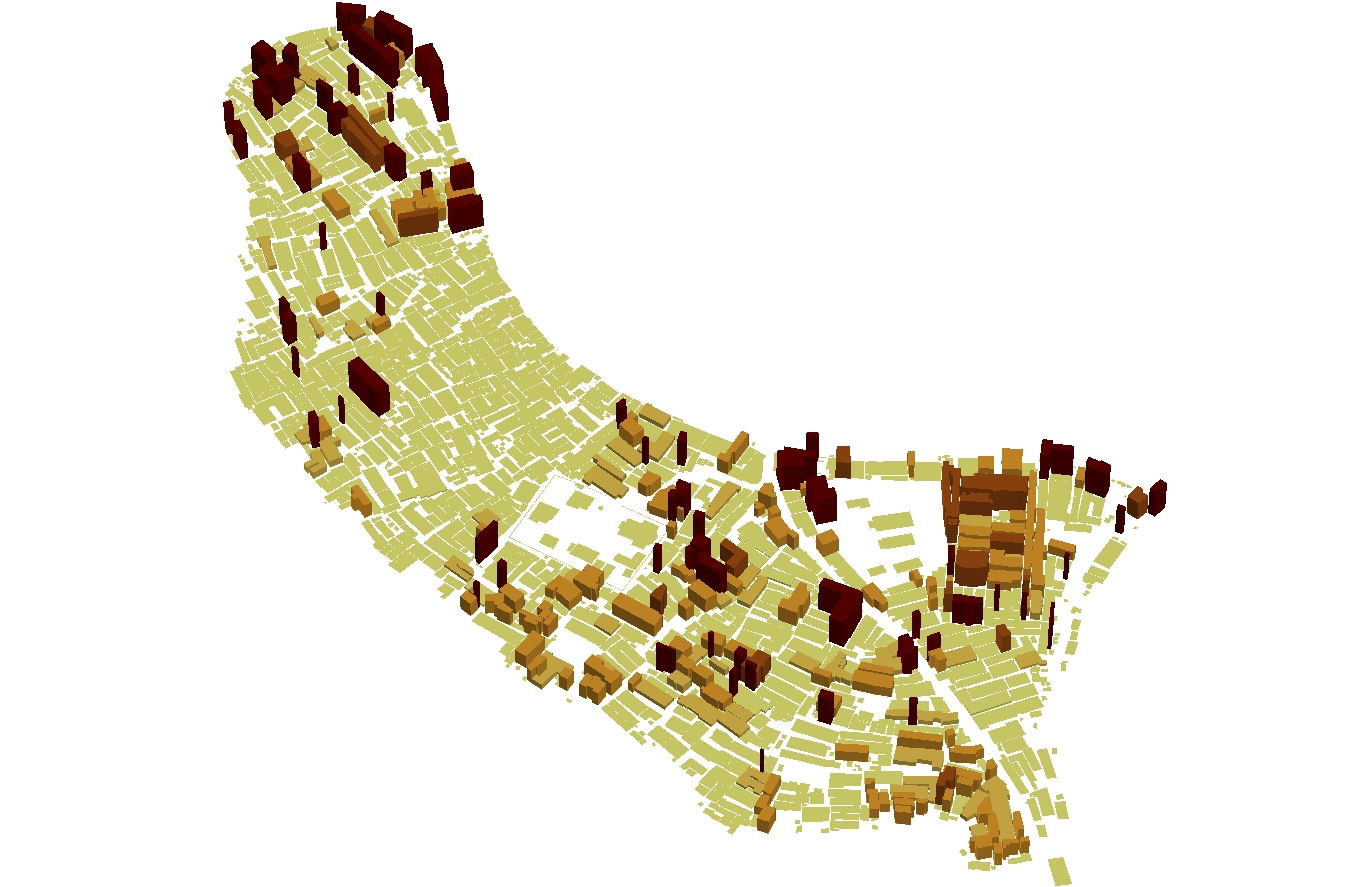
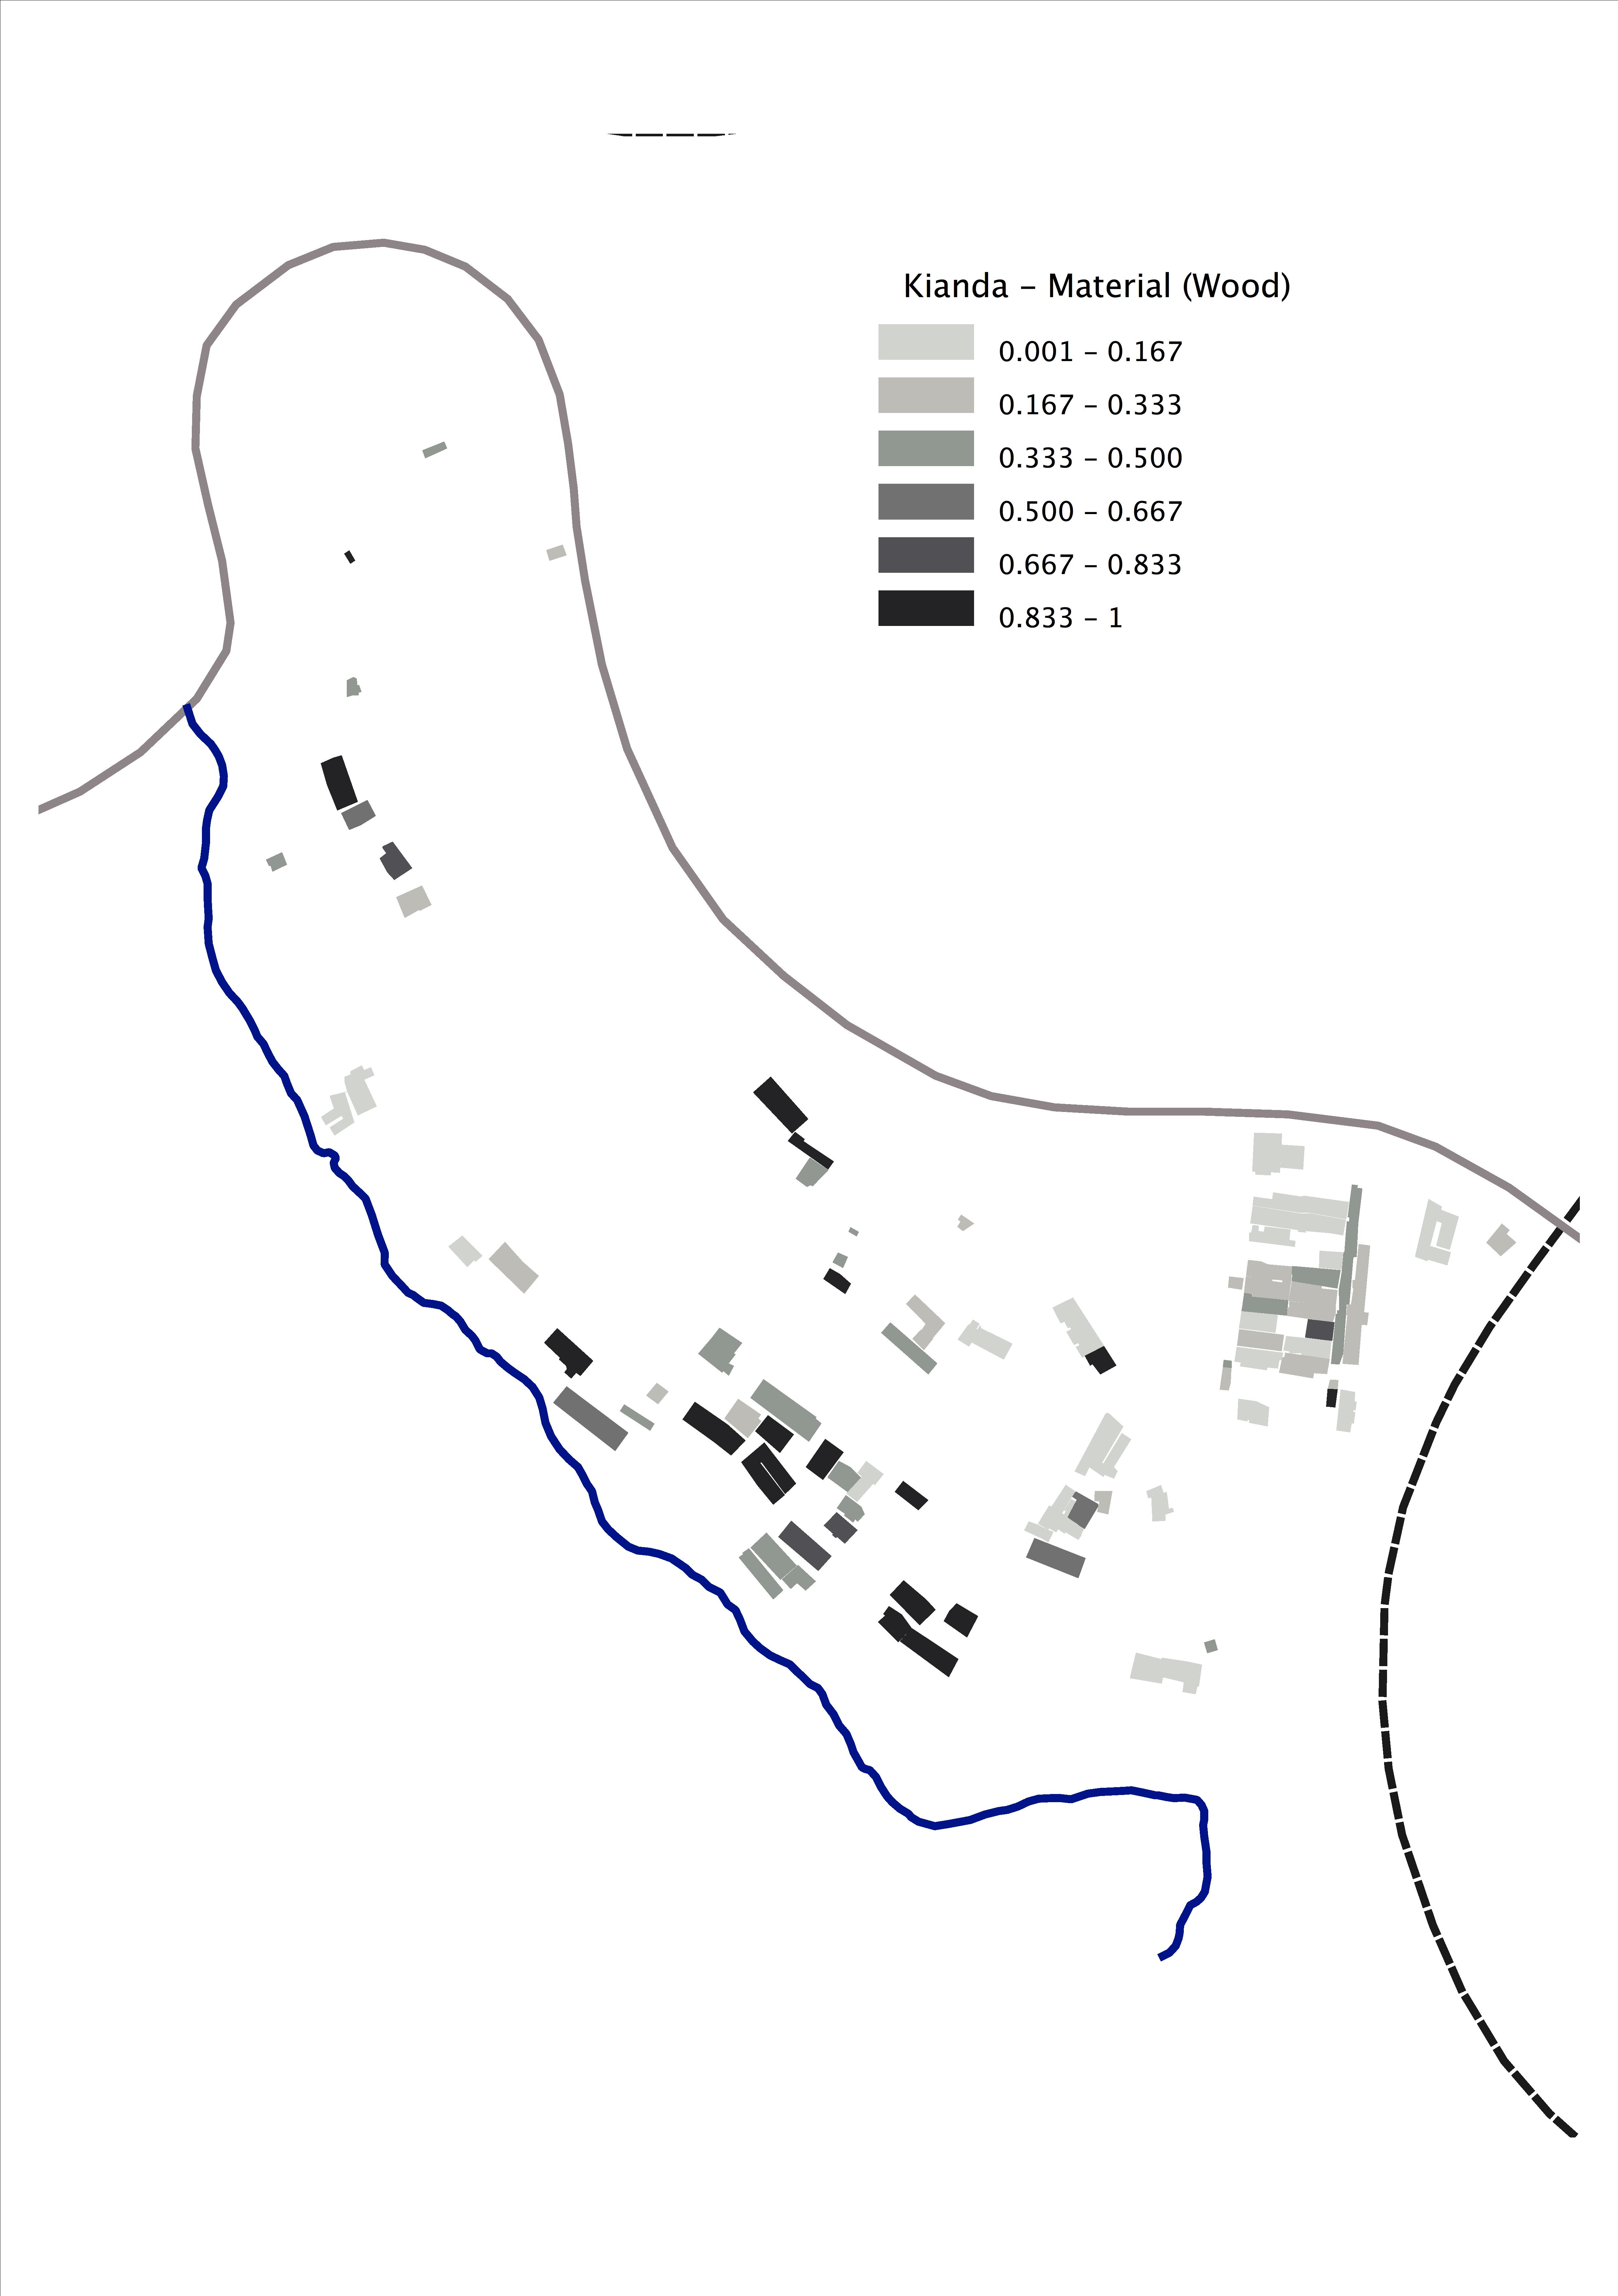
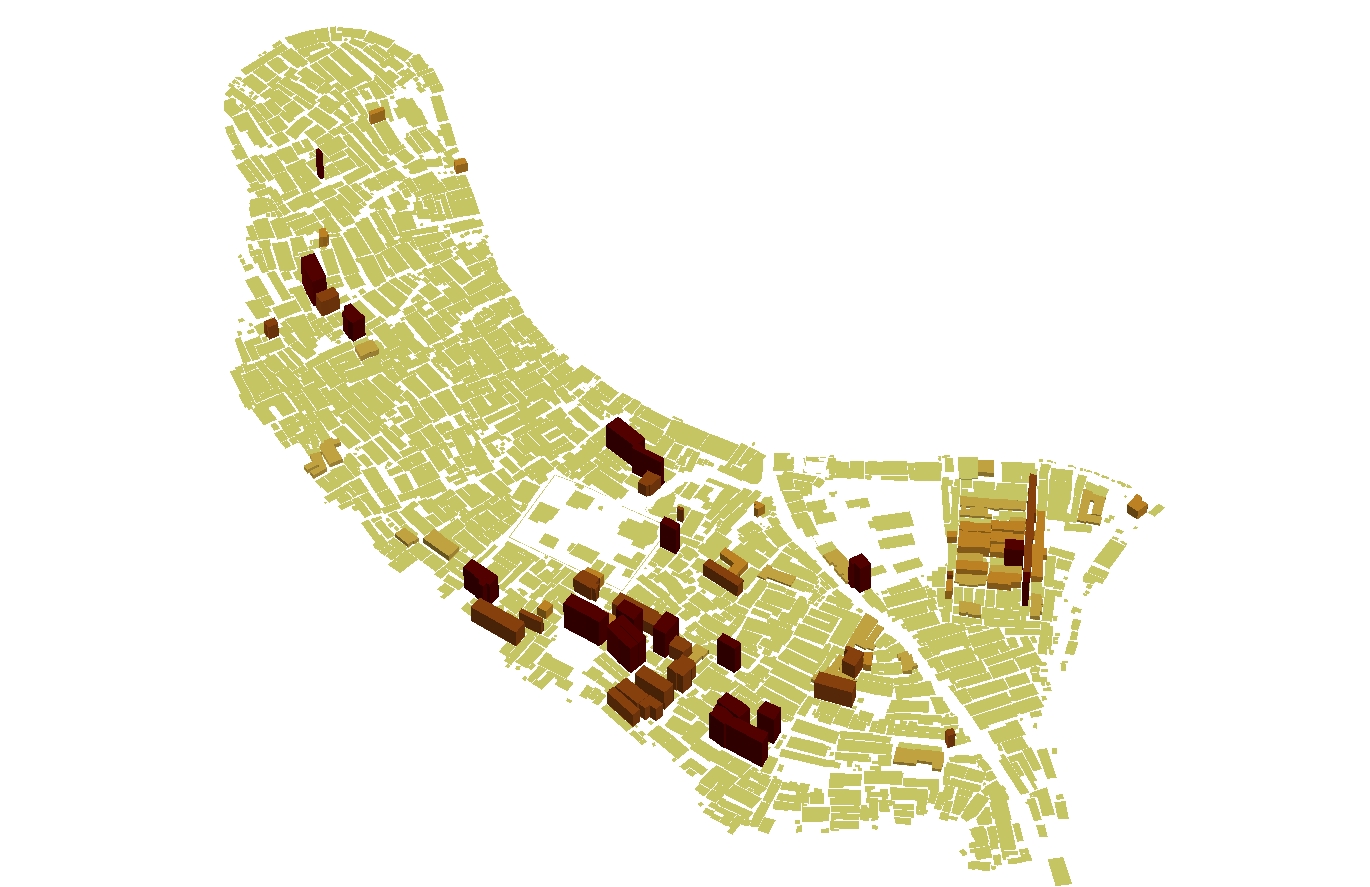
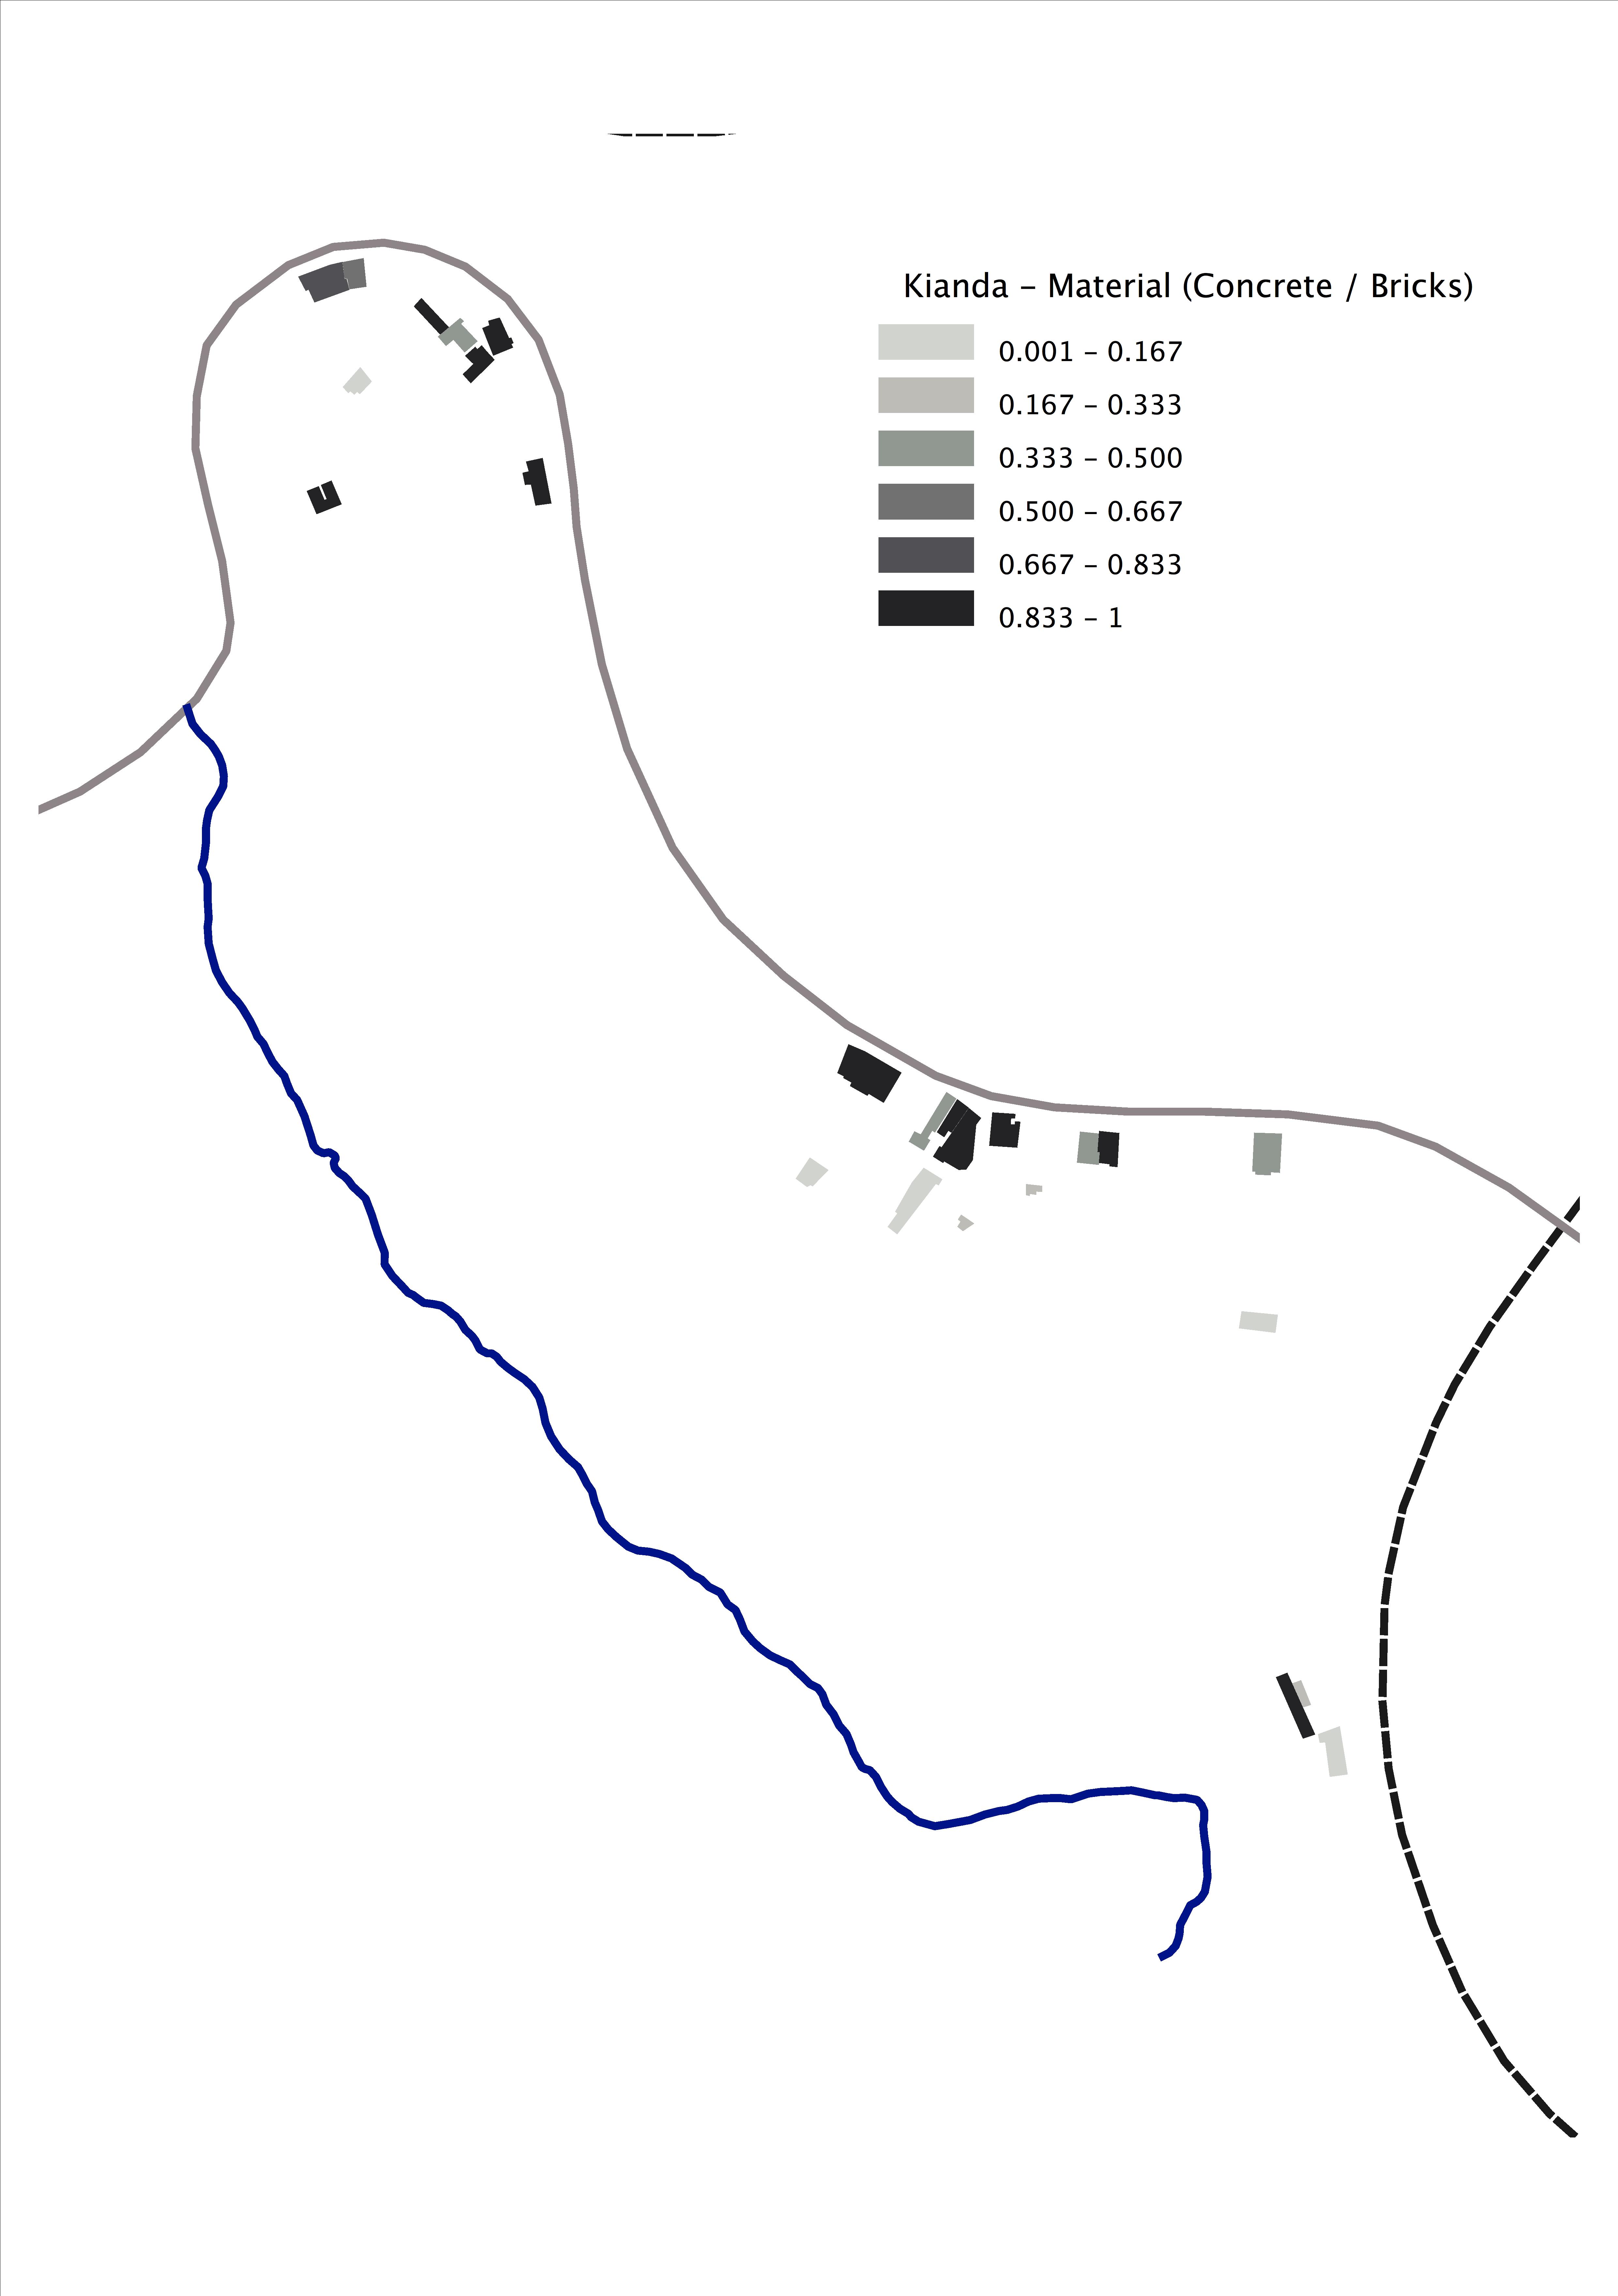
Building materials
- Mud 2D, 3D
- Iron 2D, 3D
- Wood 2D, 3D
- Concrete and bricks 2D, 3D
Business distribution 2D, 3D, GoogleEarth
Rent 2D, 3D
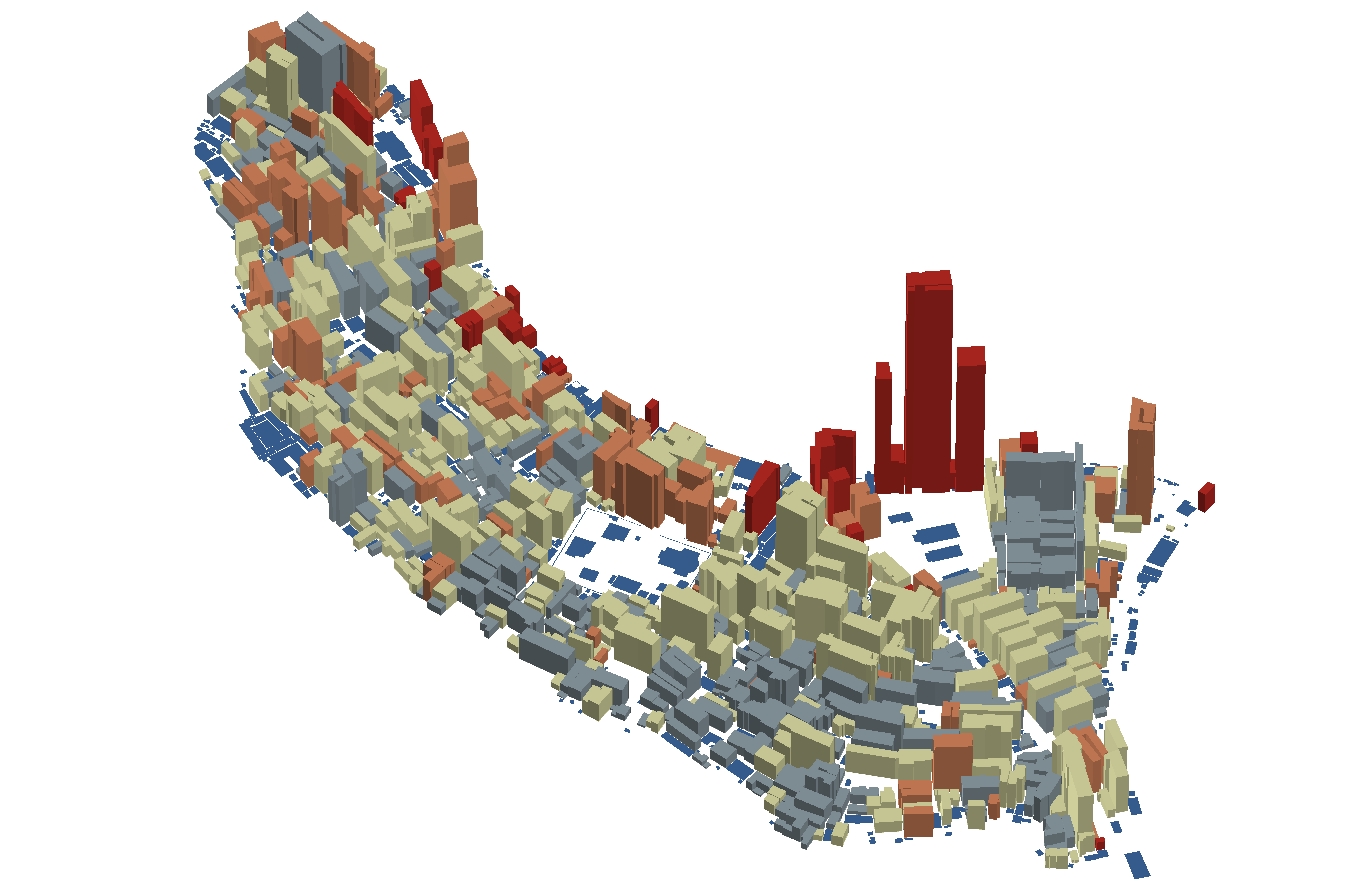
Population 2D, 3D, GoogleEarth
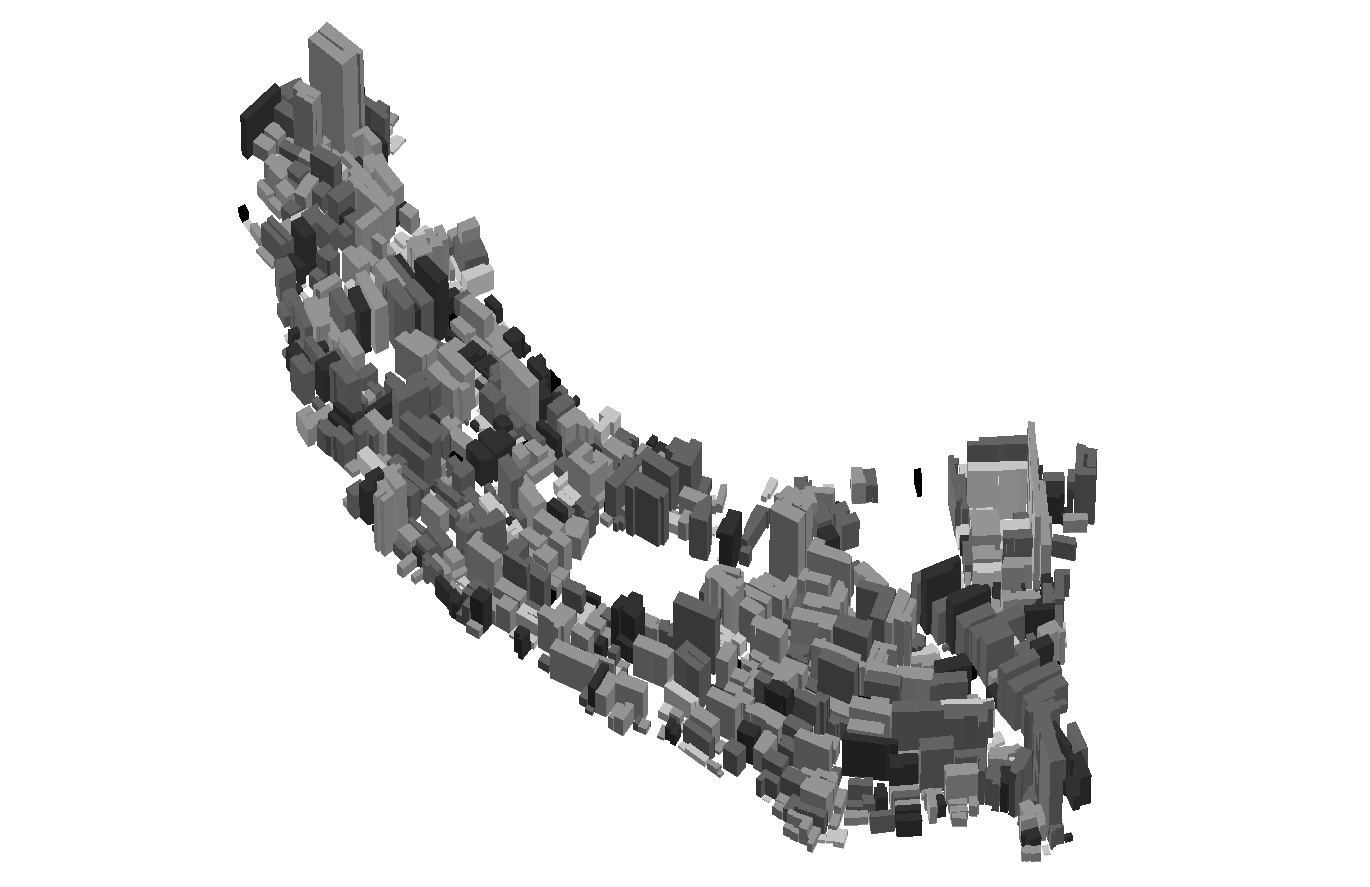
Schools & Children 2D, 3D
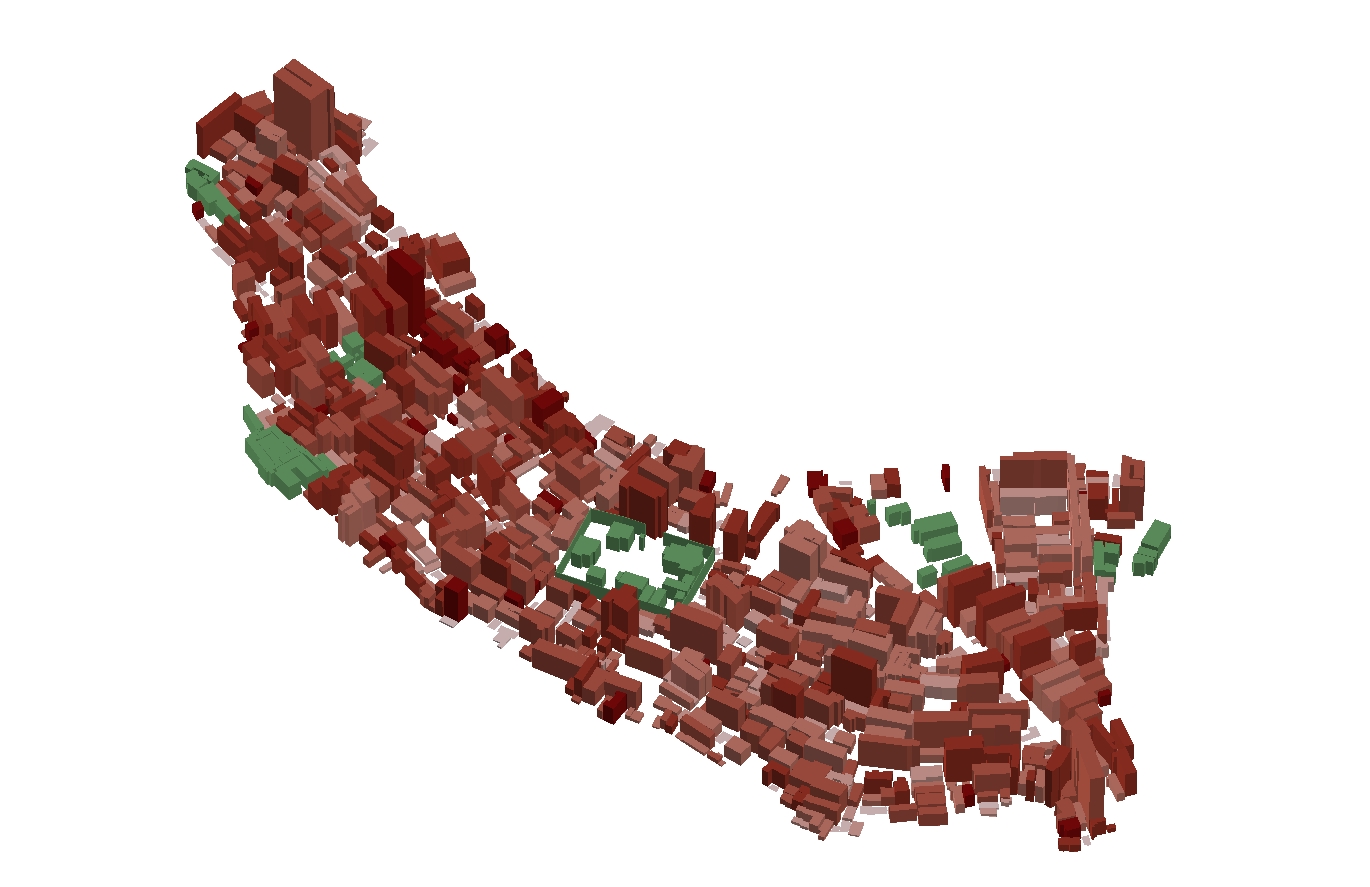
Women 2D
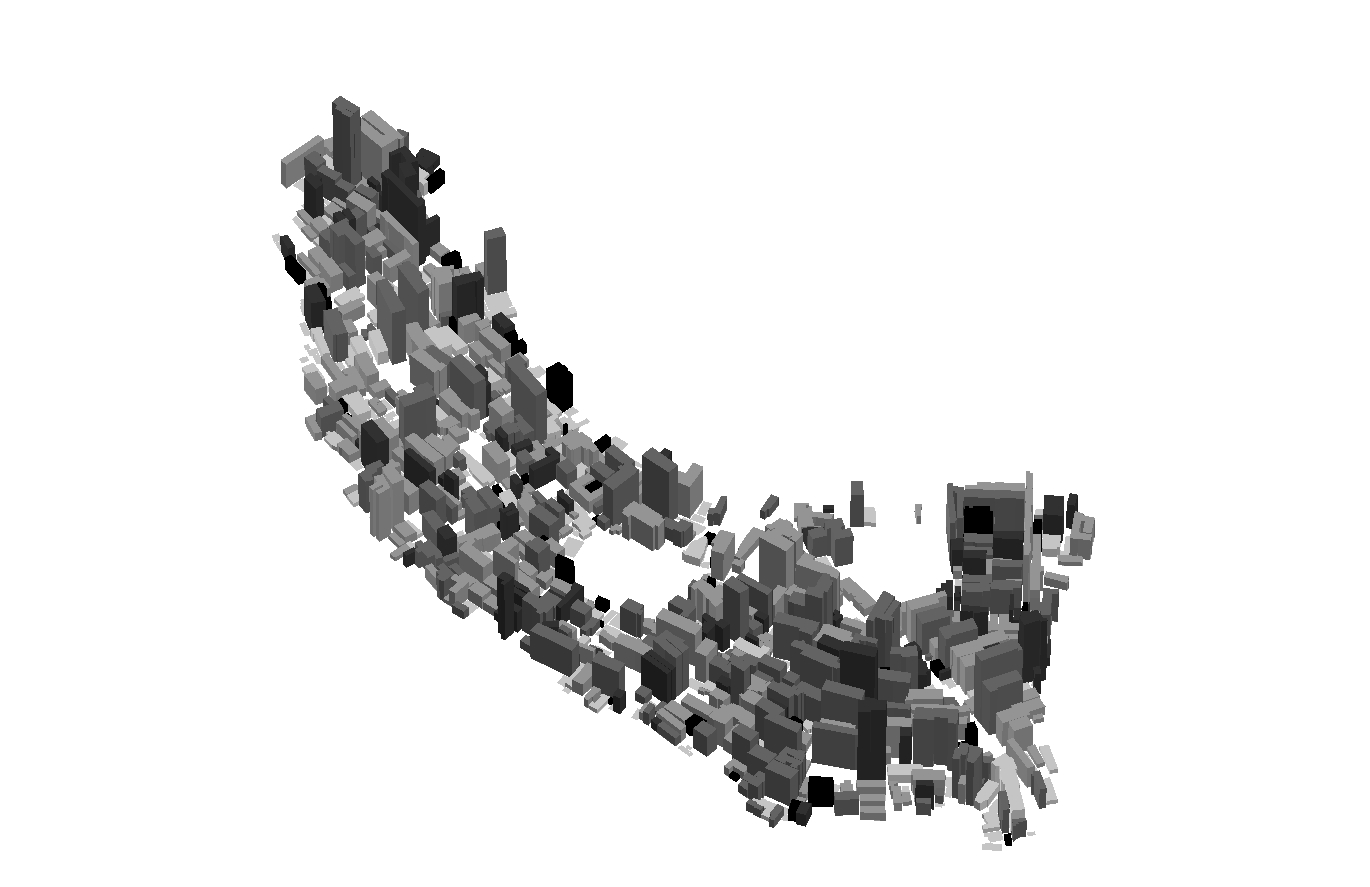
Single adults 2D, 3D
Single parents 2D, 3D
Whole Kibera Slum
Terrain (pdf)
Kibera Structures (pdf)
MKP Reports
Report on the main outcomes of the research in Kianda (pdf)
Report on schools in Kianda + Annex (pdf) |
|